

MySQL performance affects the entire web application stack.
When MySQL becomes slow, websites may take longer to load, PHP-FPM workers may stay busy, database connections may pile up, and Nginx may eventually return upstream errors. A slow database can make a healthy server look overloaded even when the original problem is a query, index, memory, or storage issue.
MySQL performance problems commonly affect:
- WordPress websites
- WooCommerce stores
- Laravel applications
- custom PHP platforms
- streaming portals
- CMS dashboards
- reporting systems
- API backends
- high-traffic dynamic websites
Optimizing MySQL does not mean changing random settings or increasing every limit. The right approach is to identify the bottleneck first, then tune the database, queries, application, or server resources based on evidence.
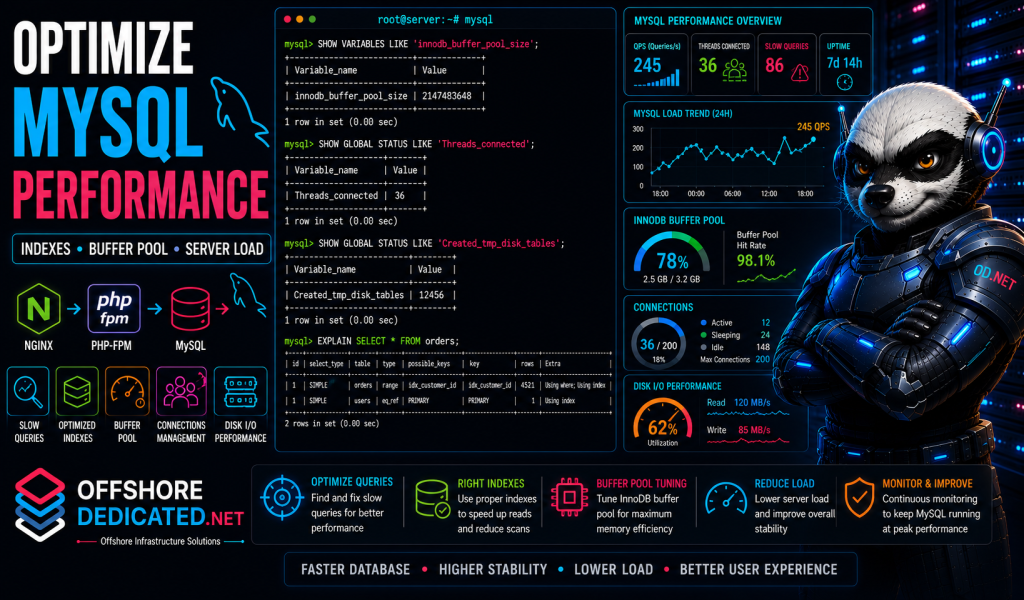
This guide explains how to optimize MySQL database performance in Linux by checking server status, slow queries, indexes, InnoDB memory, connections, temporary tables, disk I/O, PHP-FPM pressure, and caching.
Why MySQL Performance Matters
MySQL often sits in the middle of the application request path.
A common PHP web request looks like this:
Visitor
  ↓
Nginx or Apache
  ↓
PHP-FPM
  ↓
Application code
  ↓
MySQL
  ↓
Response back to visitor
If MySQL is slow, the application waits. If the application waits, PHP-FPM workers stay occupied. If enough workers are busy, new requests queue or fail. As this continues, users may see slow pages, failed logins, checkout errors, 502 errors, 504 errors, or database connection errors.
This is why MySQL tuning should be approached as part of the full server stack.
Related symptoms are explained in:
- How to Troubleshoot MySQL Too Many Connections Error
- How to Troubleshoot PHP-FPM in Linux
- How to Troubleshoot Nginx 502 Bad Gateway Error in Linux
The goal of MySQL optimization is not only to make queries faster. It is to improve stability, reduce resource waste, and prevent one database bottleneck from affecting the whole website.
Common Causes of Poor MySQL Performance
Poor MySQL performance may be caused by one issue or several issues together.
Common causes include:
- missing indexes
- inefficient queries
- large table scans
- slow joins
- excessive temporary tables
- disk-based sorts
- too many active connections
- long-running transactions
- table or row locks
- insufficient InnoDB buffer pool
- slow disk I/O
- full filesystem
- memory pressure
- oversized PHP-FPM worker pool
- high bot or traffic load
- poor application caching
- database bloat
- heavy cron jobs
- backups or exports during peak hours
For example, a slow query may keep PHP workers busy. Busy PHP workers may increase connection usage. High connection usage may lead to MySQL connection errors. Nginx may then show a 502 or 504 error even though the original bottleneck was the database.
A simple chain looks like this:
Missing index
    ↓
Slow query
    ↓
PHP request waits
    ↓
PHP-FPM workers fill up
    ↓
MySQL connections rise
    ↓
Website becomes slow or unstable
Optimization starts by locating the bottleneck instead of guessing.
Check MySQL Server Status
Start by checking whether MySQL or MariaDB is running properly.
For MySQL:
sudo systemctl status mysql --no-pager -lFor MariaDB:
sudo systemctl status mariadb --no-pager -lCheck basic MySQL status:
mysqladmin statusExample output may include:
Uptime: 172800  Threads: 42  Questions: 2145822  Slow queries: 286
Opens: 2108  Flush tables: 1  Open tables: 768
Queries per second avg: 12.41
Important fields include:
Threads— current client threadsQuestions— total statements handledSlow queries— number of slow queries recordedOpen tables— currently open tablesQueries per second avg— average query rate
Inside MySQL, check connected and running threads:
SHOW STATUS LIKE 'Threads_connected';SHOW STATUS LIKE 'Threads_running';A high number of running threads can indicate active pressure.
Check peak connection usage:
SHOW STATUS LIKE 'Max_used_connections';Check configured connection limit:
SHOW VARIABLES LIKE 'max_connections';If Max_used_connections is close to max_connections, connection limits may be part of the problem.
Review Slow Queries First
Before tuning memory or changing global MySQL settings, identify slow queries.
Check whether the slow query log is enabled:
SHOW VARIABLES LIKE 'slow_query_log';Check the slow query log path:
SHOW VARIABLES LIKE 'slow_query_log_file';Check the threshold:
SHOW VARIABLES LIKE 'long_query_time';To temporarily enable slow query logging:
SET GLOBAL slow_query_log = 'ON';To temporarily log queries taking longer than two seconds:
SET GLOBAL long_query_time = 2;Then inspect the log file:
sudo tail -n 100 /var/log/mysql/mysql-slow.logThe actual path depends on the value of slow_query_log_file.
Slow query logs help identify:
- repeated slow SELECT queries
- heavy joins
- missing-index patterns
- slow admin actions
- plugin-generated queries
- reporting queries
- large table scans
- queries causing temporary tables
For a detailed workflow, see How to Troubleshoot Slow MySQL Queries in Linux.
Optimize Indexes Carefully
Indexes help MySQL find rows efficiently.
A missing index can force MySQL to scan a large table even when only a small number of rows are needed.
Check indexes on a table:
SHOW INDEX FROM table_name;Use EXPLAIN before adding an index:
EXPLAIN SELECT * FROM orders WHERE customer_id = 12345;Important signs include:
type: ALL
key: NULL
rows: very high
Extra: Using where; Using filesort
These may indicate a full table scan or inefficient plan.
A suitable index might look like:
CREATE INDEX idx_customer_id ON orders(customer_id);However, indexes should be added carefully.
Too many indexes can:
- slow down INSERT and UPDATE operations
- increase storage usage
- make maintenance slower
- create unnecessary overhead
- confuse optimization decisions
For production systems, test index changes safely, take backups, and confirm improvement with EXPLAIN.
Do not add indexes blindly just because a table is large. Add indexes that match real query patterns.
Tune the InnoDB Buffer Pool
For most modern MySQL workloads, InnoDB is the primary storage engine.
The InnoDB buffer pool caches table and index data in memory. If it is too small, MySQL may need to read from disk more often, which can slow queries significantly.
Check buffer pool size:
SHOW VARIABLES LIKE 'innodb_buffer_pool_size';Check whether the database is using InnoDB heavily:
SHOW TABLE STATUS WHERE Engine = 'InnoDB';On a dedicated database server, the buffer pool can often use a large portion of available RAM. On a mixed web server running Nginx, PHP-FPM, MySQL, mail services, backups, and monitoring agents, memory must be shared carefully.
Check system memory:
free -mSearch for OOM events:
sudo dmesg -T | grep -Ei "out of memory|oom|killed process"Do not increase innodb_buffer_pool_size without checking available memory. If MySQL consumes too much memory, the server may start swapping or killing processes.
For deeper memory checks, see How to Diagnose Memory Pressure in Linux.
Check MySQL Connections and Thread Usage
High connection usage can reduce MySQL stability and affect performance.
Check current connections:
SHOW STATUS LIKE 'Threads_connected';Check running threads:
SHOW STATUS LIKE 'Threads_running';Check peak usage:
SHOW STATUS LIKE 'Max_used_connections';Check connection limit:
SHOW VARIABLES LIKE 'max_connections';View active sessions:
SHOW FULL PROCESSLIST;Group connections by user and host:
SELECT USER, HOST, COUNT(*) AS connections
FROM INFORMATION_SCHEMA.PROCESSLIST
GROUP BY USER, HOST
ORDER BY connections DESC;
If one application user consumes most connections, investigate that application, PHP-FPM pool, or traffic source.
High connection usage may be caused by:
- too many PHP-FPM workers
- slow queries
- sleeping sessions
- connection leaks
- traffic spikes
- bots hitting dynamic pages
- insufficient caching
- multiple websites sharing one database
For detailed connection troubleshooting, see How to Troubleshoot MySQL Too Many Connections Error.
Optimize Temporary Tables and Sorts
Some queries require temporary tables or sorting.
Check temporary table counters:
SHOW GLOBAL STATUS LIKE 'Created_tmp%';Important values include:
Created_tmp_tables
Created_tmp_disk_tables
Created_tmp_files
Disk-based temporary tables are slower than memory-based temporary tables.
A high number of disk temporary tables may indicate:
- large GROUP BY operations
- large ORDER BY operations
- queries selecting too many columns
- insufficient memory limits
- poor indexes
- large joins
- text/blob columns forcing disk temporary tables
Check sort activity:
SHOW GLOBAL STATUS LIKE 'Sort%';Use EXPLAIN on queries that show:
Using temporary
Using filesort
Possible fixes include:
- adding suitable indexes
- reducing selected columns
- improving WHERE conditions
- avoiding unnecessary sorting
- paginating large result sets
- rewriting joins
- increasing temporary table memory carefully
Do not simply raise memory limits without understanding query behavior.
Check Disk I/O and Storage Performance
MySQL performance can suffer when storage is slow or overloaded.
Check system load:
uptimeCheck disk space:
df -hCheck inode usage:
df -iCheck I/O activity if iostat is installed:
iostat -xz 1Look for high utilization, long await times, or saturated disks.
Search kernel logs for storage errors:
sudo dmesg -T | grep -Ei "I/O error|timeout|reset|EXT4-fs|XFS|read-only"Storage problems can cause:
- slow queries
- table lock delays
- high load average
- failed writes
- database stalls
- replication lag
- application timeouts
If storage is the bottleneck, query optimization may help, but the disk or underlying infrastructure must also be addressed.
For deeper analysis, see How to Investigate High Disk I/O in Linux.
Check PHP-FPM and Application Pressure
MySQL rarely operates in isolation.
On PHP websites, PHP-FPM worker behavior can directly affect database load.
Check PHP-FPM status:
sudo systemctl status php8.3-fpm --no-pager -lSearch for worker exhaustion:
sudo journalctl -u php8.3-fpm --since "1 hour ago" |
grep -i "max_children"
Check Nginx error logs:
sudo tail -n 100 /var/log/nginx/error.logIf slow MySQL queries cause PHP requests to wait, PHP-FPM workers may fill up. This can cause Nginx upstream errors even though Nginx is not the original cause.
Application-level issues may include:
- no page caching
- inefficient plugins
- large admin reports
- excessive AJAX requests
- frequent cron jobs
- search pages hitting large tables
- poorly optimized custom queries
- high bot traffic
For stack-level troubleshooting, see:
- How to Troubleshoot PHP-FPM in Linux
- How to Troubleshoot Nginx 502 Bad Gateway Error in Linux
- How to Investigate a Slow Linux Server
Use Caching to Reduce Database Load
Caching can reduce repeated database work.
Depending on the application, useful caching layers may include:
- full-page cache
- object cache
- opcode cache
- query result cache at the application level
- CDN cache for static assets
- reverse proxy cache
- Redis or Memcached
- application-level fragment caching
For WordPress, object caching can reduce repeated database queries from themes, plugins, and admin operations.
For custom applications, caching should be placed where repeated expensive operations occur.
Caching does not fix bad database design by itself, but it can reduce load significantly when the same data is requested repeatedly.
Be careful with dynamic content such as:
- shopping carts
- user dashboards
- account areas
- admin pages
- live stats
- personalized recommendations
- streaming access controls
Caching must respect freshness and user-specific content.
Practical MySQL Performance Optimization Workflow
Use this sequence when MySQL performance is poor.
1. Check MySQL service status
sudo systemctl status mysql --no-pager -lor:
sudo systemctl status mariadb --no-pager -l2. Check basic status
mysqladmin status3. Check current activity
SHOW FULL PROCESSLIST;4. Check slow query log settings
SHOW VARIABLES LIKE 'slow_query_log';
SHOW VARIABLES LIKE 'slow_query_log_file';
SHOW VARIABLES LIKE 'long_query_time';
5. Analyze slow queries with EXPLAIN
EXPLAIN SELECT ...;6. Check indexes
SHOW INDEX FROM table_name;7. Check InnoDB buffer pool
SHOW VARIABLES LIKE 'innodb_buffer_pool_size';8. Check connections
SHOW STATUS LIKE 'Threads_connected';
SHOW STATUS LIKE 'Threads_running';
SHOW STATUS LIKE 'Max_used_connections';
9. Check temporary tables
SHOW GLOBAL STATUS LIKE 'Created_tmp%';10. Check memory and OOM events
free -m
sudo dmesg -T | grep -Ei "out of memory|oom|killed process"
11. Check disk I/O
iostat -xz 1
sudo dmesg -T | grep -Ei "I/O error|timeout|reset|read-only"
12. Check PHP-FPM and web server symptoms
sudo journalctl -u php8.3-fpm --since "1 hour ago"
sudo tail -n 100 /var/log/nginx/error.log
13. Apply targeted improvements
Possible improvements include:
- adding the right index
- rewriting slow queries
- adjusting InnoDB buffer pool
- reducing unnecessary connections
- tuning PHP-FPM worker counts
- enabling object or page caching
- moving heavy cron jobs off peak hours
- improving storage
- separating database and web workloads
- upgrading infrastructure
14. Verify results
Recheck query times, process list, slow query log, PHP-FPM logs, Nginx errors, and server load.
Common MySQL Optimization Mistakes
Changing random settings
MySQL tuning should be based on evidence from queries, memory, disk I/O, and workload behavior.
Ignoring slow queries
Global tuning cannot compensate for badly written or unindexed queries.
Adding too many indexes
Indexes improve reads but can slow writes and increase storage usage.
Increasing max_connections too high
More connections can increase memory usage and allow more slow work to pile up.
Oversizing the buffer pool on a shared web server
MySQL must share memory with PHP-FPM, Nginx, and other services.
Ignoring PHP-FPM
PHP worker settings can increase database pressure.
Ignoring disk I/O
Slow storage can make even reasonable queries perform badly.
Optimizing once and never monitoring again
Workloads change as traffic, content, plugins, and database size grow.
When MySQL Performance Needs Server Management
MySQL optimization becomes more important when performance issues happen repeatedly or affect user-facing services.
Recurring symptoms may include:
- slow website pages
- high MySQL CPU usage
- slow query growth
- too many connections
- PHP-FPM worker exhaustion
- Nginx 502 or 504 errors
- high disk I/O
- high server load
- memory pressure
- checkout, login, or dashboard delays
- streaming platform backend delays
- unstable database-backed applications
OffshoreDedicated.NET provides expert server management for Linux web hosting, VPS, cloud, and dedicated server environments.
For standard MySQL-backed websites, offshore web hosting may be suitable when managed hosting is preferred.
For applications requiring root access and database tuning control, offshore VPS servers provide isolated virtual resources.
For flexible application deployment and scaling, offshore cloud servers can support changing workloads.
For heavy MySQL databases, high-traffic PHP applications, and sustained database load, offshore dedicated servers provide dedicated CPU, memory, storage, and network capacity.
For location-specific infrastructure needs, offshore Bulgaria dedicated servers are available.
For media platforms, streaming portals, and high-throughput delivery environments, offshore streaming servers can support streaming-focused infrastructure needs.
For workloads where predictable transfer capacity matters, offshore bandwidth commit servers can support high-bandwidth deployments.
The right solution depends on whether the bottleneck is query design, MySQL configuration, PHP-FPM behavior, storage performance, traffic growth, or insufficient server capacity.
Frequently Asked Questions
How do I optimize MySQL performance?
Start by checking slow queries, indexes, process list, buffer pool size, connection usage, temporary tables, disk I/O, and memory. Apply changes based on the bottleneck instead of changing random settings.
What is the most important MySQL performance setting?
For InnoDB-heavy workloads, innodb_buffer_pool_size is often important, but it should be sized according to available memory and workload. Slow queries and missing indexes should still be checked first.
How do I find slow MySQL queries?
Use the slow query log:
SHOW VARIABLES LIKE 'slow_query_log';
SHOW VARIABLES LIKE 'slow_query_log_file';
Then inspect the log file.
How do I check active MySQL queries?
Use:
SHOW FULL PROCESSLIST;Can PHP-FPM affect MySQL performance?
Yes. PHP-FPM workers can open many database connections. Slow PHP requests can keep database connections active for longer.
Can disk I/O make MySQL slow?
Yes. If storage is saturated or failing, MySQL queries may slow down even if query design is reasonable.
Should I increase max_connections for better performance?
Not automatically. Increasing max_connections may help connection limits, but it can also increase memory pressure. Fix slow queries and application connection behavior first.
Final Thoughts
MySQL optimization works best when it is evidence-based.
Start with:
mysqladmin statusThen check:
SHOW FULL PROCESSLIST;
SHOW VARIABLES LIKE 'slow_query_log';
SHOW VARIABLES LIKE 'innodb_buffer_pool_size';
SHOW STATUS LIKE 'Threads_connected';
SHOW GLOBAL STATUS LIKE 'Created_tmp%';
Also inspect server-level conditions:
free -m
uptime
iostat -xz 1
sudo dmesg -T | grep -Ei "I/O error|timeout|reset|out of memory|oom"
The best performance gains often come from fixing slow queries, adding the right indexes, improving caching, tuning memory safely, reducing unnecessary connections, and matching the workload with the right infrastructure.
A well-optimized MySQL server improves not only database speed, but also PHP-FPM stability, web server response times, and overall application reliability.