This is not a tutorial.
This is how real incidents are handled in production.
When a server is slow, you are not experimenting — you are diagnosing under pressure.
This guide will take you from zero understanding to real-world debugging capability.

The Real Situation
You log in.
The complaint is simple:
“Server is slow.”
But that tells you nothing.
Your job is to convert symptoms into facts.
The Only Correct Debugging Flow
Never jump randomly between commands.
Follow this exact order:
- Load → confirms problem exists
- CPU → checks if system is busy
- Memory → checks pressure
- Disk / I/O → uncovers hidden bottleneck
- Processes → identifies culprit
- Process states → explains behavior
👉 This order is not optional. This is how production debugging works.
Step 1: Check Load (Symptom Detection)
uptimeExample:
load average: 12.20, 10.50, 8.90Interpretation
- If you have 4 cores → load should be ~4 or less
- If load = 12 → system is overloaded
👉 Load is NOT CPU usage. It includes waiting processes.
Step 2: Check CPU (Is It Actually Busy?)
topLook at:
- %us (user CPU)
- %sy (system CPU)
- %id (idle CPU)
Key Scenarios
Case A: High CPU usage
- CPU ~90%+ → CPU is bottleneck
Case B: Low CPU but high load ⚠️
- CPU idle is high
- Load is high
👉 This means processes are waiting (NOT CPU issue)
This is where beginners get it wrong.
Step 3: Check Memory (Pressure vs Usage)
free -mCorrect Interpretation
Ignore “used memory” — focus on:
- available
- swap usage
Case A: Low available memory
→ system under pressure
Case B: High swap usage ⚠️
→ severe slowdown likely
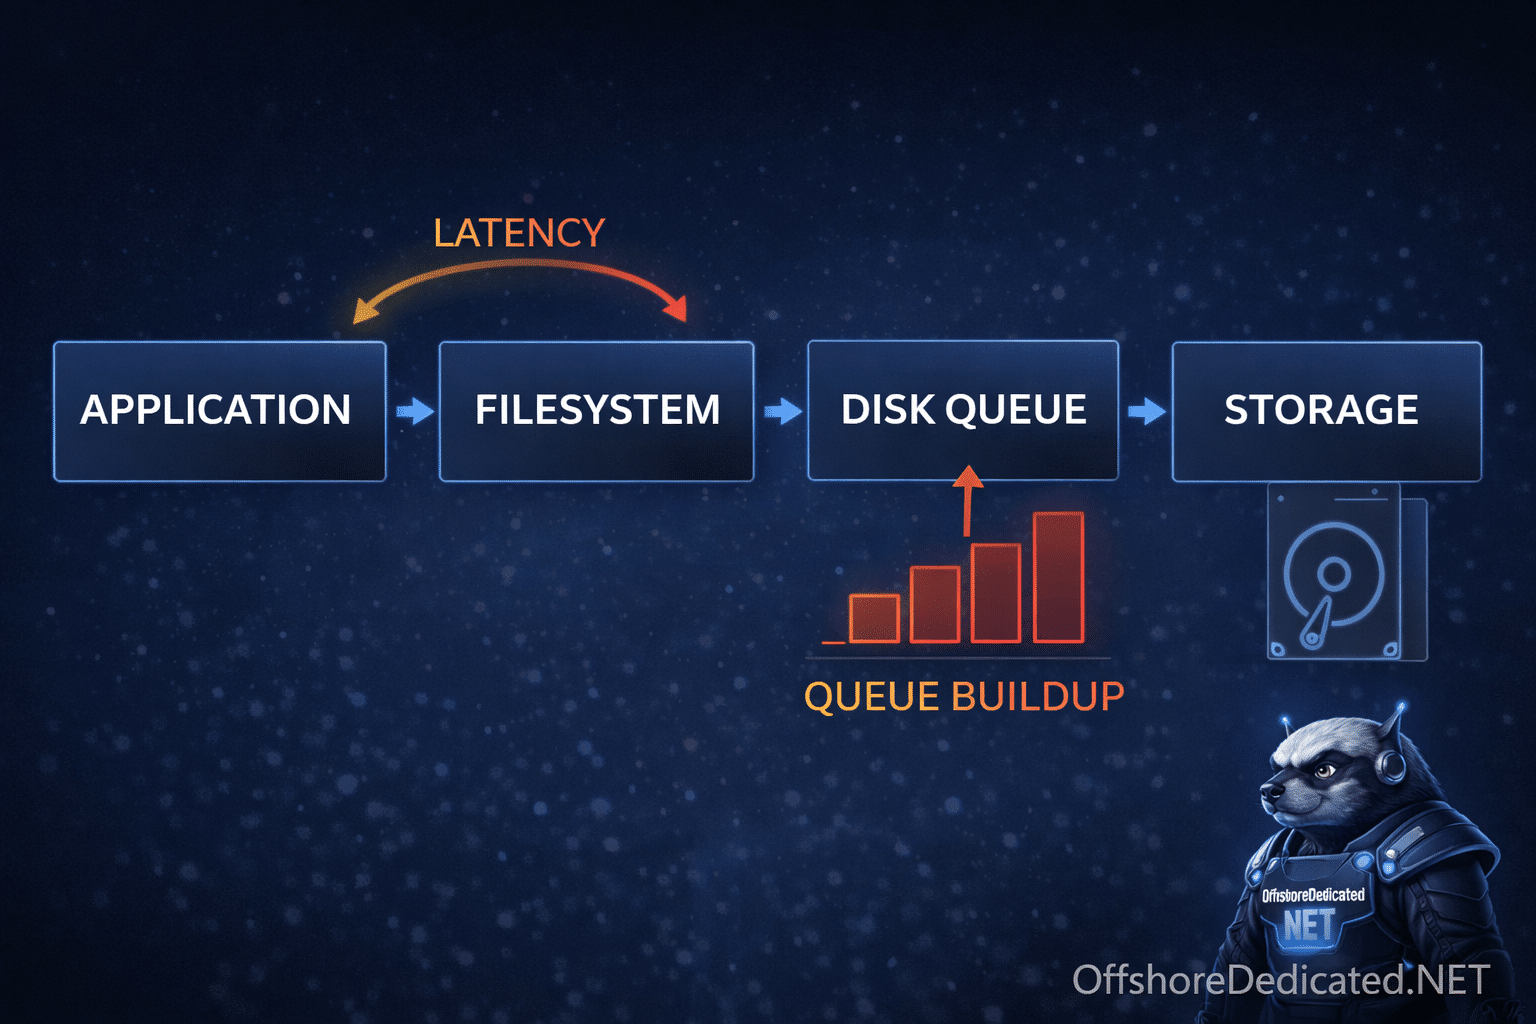
Step 4: Disk & I/O (Where Most Real Issues Exist)
iostat -x 1What to Look For
- %util near 100%
- await high (e.g., >50ms)
Example Interpretation
%util = 99%
await = 120ms
👉 Disk is saturated 👉 This will slow EVERYTHING
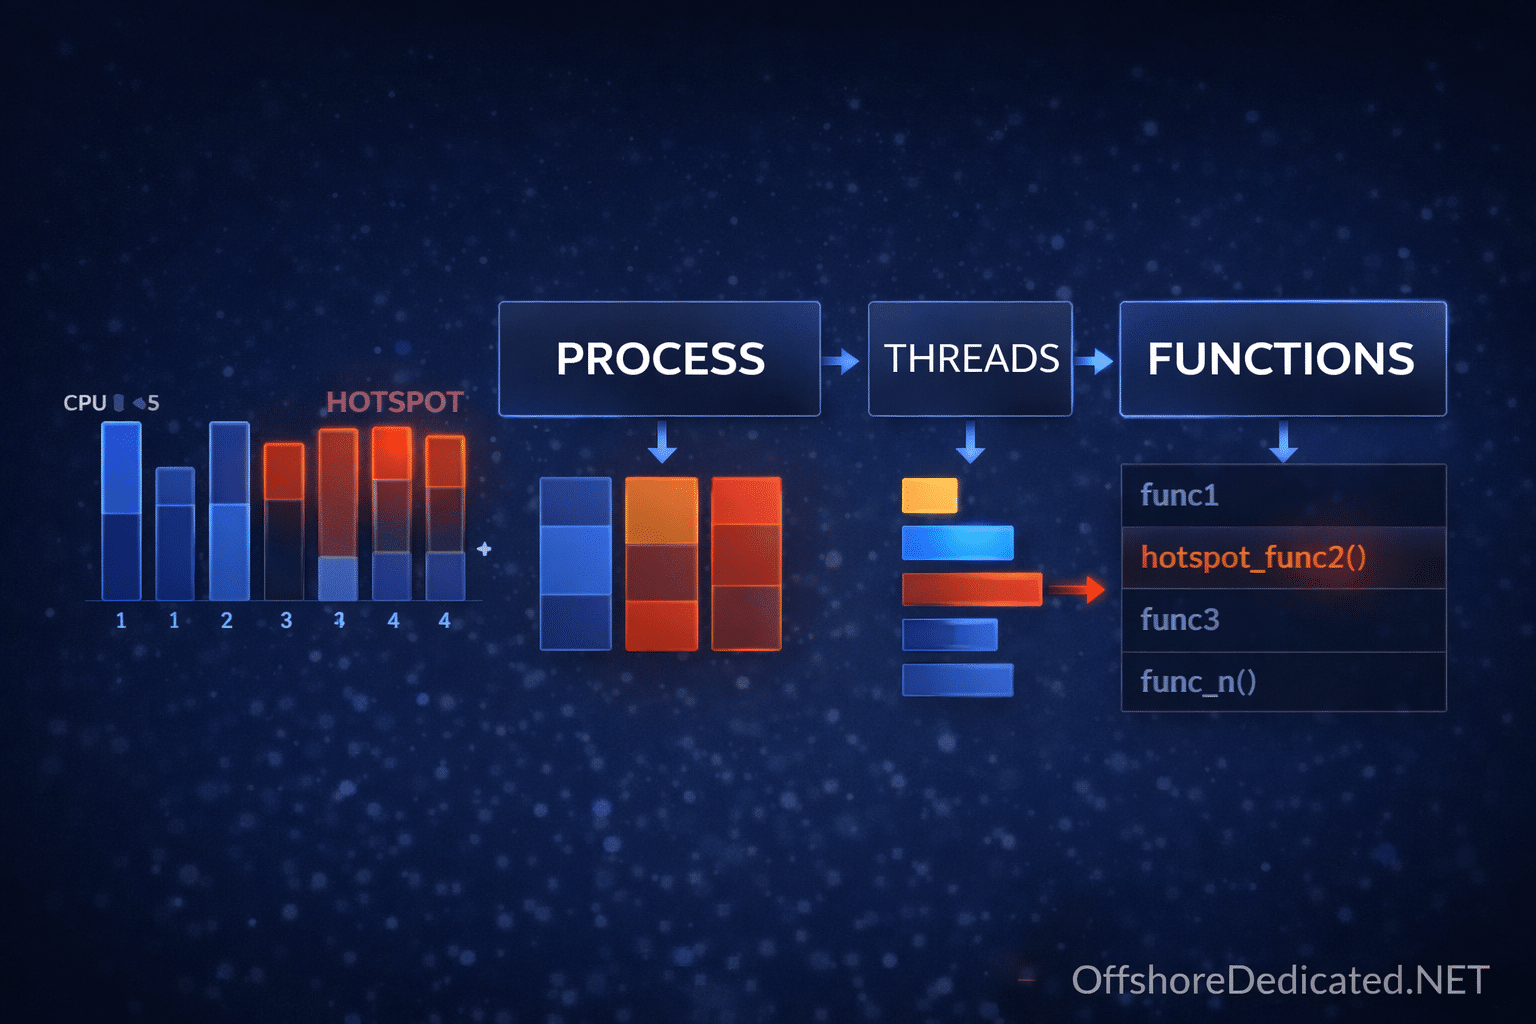
Step 5: Identify the Culprit Process
htopWhat Experts Do Here
- Sort by CPU → find heavy CPU users
- Sort by MEM → find memory leaks
- Switch to tree view (F5 / Fn+F5 on Mac)
👉 Understand parent-child structure
Step 6: Check Process States (The Truth Layer)
ps -eo pid,stat,cmd | grep DInterpretation
If many processes are in:
👉 D state (uninterruptible sleep)
Then:
- They are waiting on I/O
- You CANNOT kill them
👉 Root cause is almost always disk or storage
Step 7: Deep Investigation (Expert Layer)
Now you move from observation → root cause
Check what process is doing
strace -p PIDIf you see repeated reads/writes → disk issue
Check open files
lsof -p PIDUseful for:
- File locks
- Stuck file handles
Full Real-World Example (This Is What Experts Actually Do)
Situation
- Website slow
- Users complaining
Step 1: Load
uptime → load = 18→ confirmed issue
Step 2: CPU
top → CPU idle = 70%→ NOT CPU problem
Step 3: Memory
free -m → available OK→ NOT memory problem
Step 4: Disk
iostat → %util = 100%
await = high
→ DISK bottleneck
Step 5: Processes
htop → many processes waitingStep 6: States
ps → many D-state processesFinal Diagnosis
👉 Disk I/O bottleneck causing system-wide slowdown
NOT CPU NOT memory
Time-Based Thinking (Expert Mindset)
Ask:
- Did this happen suddenly?
- Or gradually?
Sudden issue
→ traffic spike, disk failure, bad deploy
Gradual issue
→ memory leak, log growth, database bloat
Common Mistakes (Reality Check)
❌ “High load = CPU issue”
Wrong in many real cases
❌ Killing processes blindly
You may kill symptoms, not cause
❌ Ignoring disk
Most real-world slowdowns are I/O related
When This Matters in Production
This workflow applies to:
- VPS servers
- Dedicated servers
- Cloud servers
If you are running real workloads, this is not optional knowledge.
👉 Infrastructure options:
Related Linux Guides
- How to Check CPU Usage in Linux
- How to Check Memory Usage in Linux
- How to Check Server Load in Linux
- How to Check Running Processes in Linux
- Linux Process States Explained
Final Takeaway
A beginner runs commands.
An intermediate user reads metrics.
An expert:
👉 Connects symptoms → metrics → root cause
That is what keeps systems stable.