

Slow MySQL queries can make an entire website or application feel broken.
A single inefficient query can delay page loads, keep PHP workers occupied, increase database connections, raise server load, and eventually cause user-facing errors such as timeouts or “Too many connections.”
On Linux servers, slow MySQL queries commonly affect:
- WordPress websites
- WooCommerce stores
- Laravel applications
- custom PHP applications
- reporting dashboards
- admin panels
- database-heavy APIs
- high-traffic dynamic websites
When queries become slow, the problem is not always MySQL itself. The root cause may be missing indexes, poor query design, table locks, slow disk I/O, insufficient memory, overloaded PHP-FPM workers, or a server that has outgrown its current infrastructure.
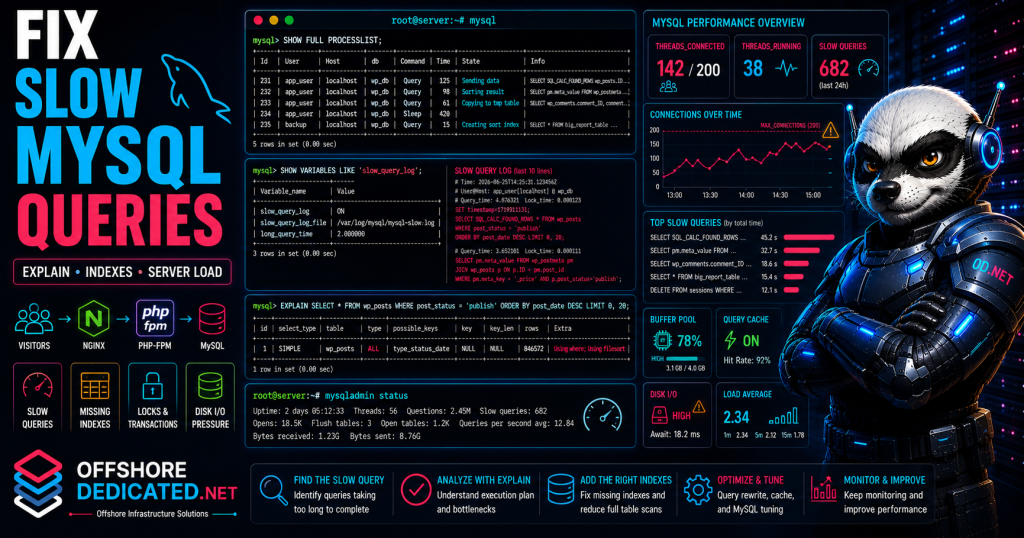
This guide explains how to troubleshoot slow MySQL queries in Linux using SHOW PROCESSLIST, the MySQL slow query log, EXPLAIN, index checks, server resource diagnostics, and application-level investigation.
What Are Slow MySQL Queries?
A slow MySQL query is a database query that takes longer than expected to complete.
The exact meaning of “slow” depends on the workload.
For example:
- A login query should usually complete very quickly.
- A product search may take longer.
- A report over millions of rows may naturally take more time.
- An admin export may be slow but acceptable if it is not user-facing.
A slow query becomes a server problem when it affects application performance or causes other processes to wait.
A typical chain reaction looks like this:
Slow MySQL query
    ↓
PHP request waits longer
    ↓
PHP-FPM worker stays busy
    ↓
More requests pile up
    ↓
MySQL connections increase
    ↓
Website becomes slow or unstable
This is why slow MySQL queries are closely related to PHP-FPM worker exhaustion and MySQL connection saturation.
For related symptoms, see:
- How to Troubleshoot MySQL Too Many Connections Error
- How to Troubleshoot PHP-FPM in Linux
- How to Troubleshoot Nginx 502 Bad Gateway Error in Linux
Common Causes of Slow MySQL Queries
Slow MySQL queries can have many causes.
Common reasons include:
- missing indexes
- inefficient joins
- queries scanning large tables
- too many rows sorted or grouped
- temporary tables on disk
- table locks
- long transactions
- overloaded storage
- insufficient memory
- poor database design
- plugin or application bloat
- high traffic
- background cron jobs
- backups or exports running during peak hours
- too many simultaneous connections
- server resource limits
For example, a WordPress plugin may add a query that scans a large wp_postmeta table without a useful index. As the website grows, the query becomes slower. Eventually, PHP requests wait for MySQL, PHP-FPM workers remain occupied, and the site starts timing out.
The key is to identify whether the problem is:
- one specific slow query
- many slow queries
- database locks
- storage I/O
- memory pressure
- application behavior
- server capacity
The troubleshooting process should start with current database activity.
Check Current MySQL Performance Status
First, check whether MySQL or MariaDB is running normally.
For MySQL:
sudo systemctl status mysql --no-pager -lFor MariaDB:
sudo systemctl status mariadb --no-pager -lCheck basic MySQL status:
mysqladmin statusExample output may include:
Uptime: 172800  Threads: 48  Questions: 1854321  Slow queries: 326
Opens: 1024  Flush tables: 1  Open tables: 512
Queries per second avg: 10.73
Important fields include:
Threads— current client threadsQuestions— total statements executedSlow queries— number of queries considered slowOpen tables— currently open tablesQueries per second avg— average query rate
This command gives a quick overview but does not show which queries are slow.
Log into MySQL for deeper checks:
mysql -u root -pCheck current connected sessions:
SHOW STATUS LIKE 'Threads_connected';Check currently running threads:
SHOW STATUS LIKE 'Threads_running';If Threads_running is high for your server size, MySQL may be under active query pressure.
Check slow query count:
SHOW GLOBAL STATUS LIKE 'Slow_queries';These counters help confirm whether slow queries are actually occurring, but the next step is to identify the queries themselves.
Find Running Queries with SHOW PROCESSLIST
The fastest way to inspect live MySQL activity is:
SHOW PROCESSLIST;For full query text, use:
SHOW FULL PROCESSLIST;Important columns include:
Id
User
Host
db
Command
Time
State
Info
The Time column shows how long the current command has been running.
To find long-running active queries:
SELECT ID, USER, HOST, DB, COMMAND, TIME, STATE, INFO
FROM INFORMATION_SCHEMA.PROCESSLIST
WHERE COMMAND != 'Sleep'
ORDER BY TIME DESC
LIMIT 20;
Look for queries with high TIME values.
The STATE column may show clues such as:
Sending data
Copying to tmp table
Sorting result
Waiting for table metadata lock
Locked
Creating sort index
Waiting for handler commit
These states help you understand whether MySQL is scanning rows, sorting data, waiting for locks, or writing temporary data.
To find long sleeping sessions:
SELECT ID, USER, HOST, DB, COMMAND, TIME
FROM INFORMATION_SCHEMA.PROCESSLIST
WHERE COMMAND = 'Sleep'
ORDER BY TIME DESC
LIMIT 20;
Sleeping sessions are not always bad, but too many long-lived sleeping connections can contribute to connection saturation. For connection-specific troubleshooting, see how to troubleshoot MySQL Too Many Connections.
Enable and Check the MySQL Slow Query Log
The MySQL slow query log records queries that take longer than a configured threshold.
Check whether it is enabled:
SHOW VARIABLES LIKE 'slow_query_log';Check the slow query log file path:
SHOW VARIABLES LIKE 'slow_query_log_file';Check the threshold:
SHOW VARIABLES LIKE 'long_query_time';Example:
long_query_time = 10.000000This means queries taking longer than 10 seconds may be logged.
To temporarily enable the slow query log:
SET GLOBAL slow_query_log = 'ON';To temporarily lower the threshold:
SET GLOBAL long_query_time = 2;This helps capture queries taking longer than two seconds.
To make changes persistent, edit the MySQL or MariaDB configuration file.
Common locations include:
/etc/mysql/mysql.conf.d/mysqld.cnf
/etc/mysql/mariadb.conf.d/50-server.cnf
/etc/my.cnf
/etc/my.cnf.d/server.cnf
Under [mysqld], add or adjust:
[mysqld]
slow_query_log = 1
slow_query_log_file = /var/log/mysql/mysql-slow.log
long_query_time = 2
Then restart MySQL during a controlled maintenance window:
sudo systemctl restart mysqlOr:
sudo systemctl restart mariadbRead the slow query log:
sudo tail -n 100 /var/log/mysql/mysql-slow.logSearch it:
sudo grep -i "Query_time" /var/log/mysql/mysql-slow.log | tail -50If the file is elsewhere, use the path from:
SHOW VARIABLES LIKE 'slow_query_log_file';For general log-file commands, see how to read Linux logs in /var/log.
Use EXPLAIN to Understand Query Execution
Once you identify a slow query, use EXPLAIN to see how MySQL plans to execute it.
Example:
EXPLAIN SELECT * FROM wp_posts WHERE post_status = 'publish';For newer MySQL versions, EXPLAIN ANALYZE may provide actual execution details:
EXPLAIN ANALYZE SELECT * FROM wp_posts WHERE post_status = 'publish';Important EXPLAIN fields include:
table
type
possible_keys
key
rows
Extra
Key things to watch:
type = ALLmay indicate a full table scan.key = NULLmeans no index is being used.- high
rowsmeans MySQL expects to examine many rows. Using temporarymay indicate temporary table usage.Using filesortmay indicate extra sorting work.Using wheremeans filtering is applied.
A full table scan is not always bad on a tiny table, but it can become a serious problem on large tables.
Example concern:
type: ALL
key: NULL
rows: 850000
Extra: Using where; Using filesort
This suggests MySQL may need to scan and sort a large number of rows.
Use EXPLAIN before changing indexes or rewriting queries. Guessing without checking the execution plan can create new problems.
Check Missing Indexes
Missing indexes are one of the most common causes of slow MySQL queries.
Indexes help MySQL find rows without scanning the entire table.
Show indexes for a table:
SHOW INDEX FROM table_name;Example:
SHOW INDEX FROM wp_posts;A slow query with a WHERE, JOIN, ORDER BY, or GROUP BY clause may benefit from an index, depending on the query and table structure.
Example query:
SELECT * FROM orders WHERE customer_id = 12345;If customer_id is not indexed and the table is large, MySQL may scan many rows.
Possible index:
CREATE INDEX idx_customer_id ON orders(customer_id);However, indexes are not free.
Too many indexes can:
- slow down writes
- increase storage usage
- complicate optimization
- create maintenance overhead
Before adding an index, check:
- query frequency
- table size
- existing indexes
- query execution plan
- whether the index matches the actual filtering pattern
- whether a composite index is more appropriate
For production databases, test index changes carefully and take backups before structural changes.
Check Database Locks and Long Transactions
Sometimes queries are slow because they are waiting for locks.
In the process list, look for states such as:
Locked
Waiting for table metadata lock
Waiting for row lock
Find long-running queries:
SELECT ID, USER, HOST, DB, COMMAND, TIME, STATE, INFO
FROM INFORMATION_SCHEMA.PROCESSLIST
WHERE COMMAND != 'Sleep'
ORDER BY TIME DESC
LIMIT 20;
If InnoDB is used, check engine status:
SHOW ENGINE INNODB STATUS\GThis can show lock waits, transactions, deadlocks, and other InnoDB details.
Long transactions may block other operations. They may be caused by:
- application code not committing
- large updates
- backups
- schema changes
- imports
- admin operations
- reporting jobs
- abandoned sessions
Do not kill database sessions randomly on production systems.
If you must terminate a problematic query, identify it carefully:
KILL QUERY process_id;To terminate the entire connection:
KILL process_id;Killing the wrong session can interrupt legitimate application activity or administrative work.
Check MySQL Memory and Buffer Settings
MySQL performance depends heavily on memory.
For InnoDB-heavy workloads, the buffer pool is especially important.
Check buffer pool size:
SHOW VARIABLES LIKE 'innodb_buffer_pool_size';Check database size and workload before changing it. A tiny buffer pool on a large active database can cause excessive disk reads.
Check temporary table behavior:
SHOW GLOBAL STATUS LIKE 'Created_tmp%';Important values include:
Created_tmp_tables
Created_tmp_disk_tables
A high number of disk-based temporary tables may indicate queries are spilling to disk.
Check table cache pressure:
SHOW GLOBAL STATUS LIKE 'Open_tables';
SHOW GLOBAL STATUS LIKE 'Opened_tables';
Memory tuning should be done carefully because MySQL shares server memory with:
- PHP-FPM
- Nginx
- system services
- backup tools
- monitoring agents
- operating system cache
Check server memory:
free -mSearch for OOM kills:
sudo dmesg -T | grep -Ei "out of memory|oom|killed process"For deeper memory checks, see how to diagnose memory pressure in Linux.
Check Disk I/O and Server Load
Slow MySQL queries may be caused by storage bottlenecks.
Check load average:
uptimeCheck disk space:
df -hCheck inode usage:
df -iCheck I/O activity with iostat if available:
iostat -xz 1Look for high disk utilization, high await times, or saturated storage.
Check kernel messages for disk errors:
sudo dmesg -T | grep -Ei "I/O error|timeout|reset|EXT4-fs|XFS|read-only"If MySQL is waiting on slow storage, query optimization may help, but the underlying storage issue must also be addressed.
For deeper storage analysis, see how to investigate high disk I/O in Linux.
For broader system checks, see how to investigate a slow Linux server.
Check Application and PHP-FPM Impact
Slow MySQL queries can affect PHP-FPM and the web server.
When PHP waits for MySQL, PHP-FPM workers remain busy. If enough workers are occupied, new web requests must wait or fail.
Check PHP-FPM status:
sudo systemctl status php8.3-fpm --no-pager -lSearch for worker exhaustion:
sudo journalctl -u php8.3-fpm --since "1 hour ago" |
grep -i "max_children"
Check Nginx errors:
sudo tail -n 100 /var/log/nginx/error.logA database slowdown can produce symptoms such as:
- PHP-FPM
pm.max_childrenwarnings - Nginx upstream timeouts
- 502 or 504 errors
- slow admin pages
- failed checkout or login actions
- high MySQL connections
The database may be the root cause even when the visible error appears in Nginx or PHP-FPM logs.
Practical Slow Query Troubleshooting Workflow
Use this sequence when MySQL queries appear slow.
1. Check MySQL service status
sudo systemctl status mysql --no-pager -lor:
sudo systemctl status mariadb --no-pager -l2. Check current database activity
SHOW FULL PROCESSLIST;3. Find long-running active queries
SELECT ID, USER, HOST, DB, TIME, STATE, INFO
FROM INFORMATION_SCHEMA.PROCESSLIST
WHERE COMMAND != 'Sleep'
ORDER BY TIME DESC
LIMIT 20;
4. Check slow query log settings
SHOW VARIABLES LIKE 'slow_query_log';
SHOW VARIABLES LIKE 'slow_query_log_file';
SHOW VARIABLES LIKE 'long_query_time';
5. Review the slow query log
sudo tail -n 100 /var/log/mysql/mysql-slow.log6. Analyze a slow query with EXPLAIN
EXPLAIN SELECT ...;7. Check indexes
SHOW INDEX FROM table_name;8. Check locks and transactions
SHOW ENGINE INNODB STATUS\G9. Check memory
free -m10. Check disk I/O and kernel errors
iostat -xz 1
sudo dmesg -T | grep -Ei "I/O error|timeout|reset|read-only"
11. Check PHP-FPM and Nginx symptoms
sudo journalctl -u php8.3-fpm --since "1 hour ago"
sudo tail -n 100 /var/log/nginx/error.log
12. Apply the correct fix
Possible fixes include:
- adding a suitable index
- rewriting a query
- reducing unnecessary joins
- optimizing application code
- reducing plugin overhead
- enabling caching
- adjusting MySQL memory settings
- fixing lock contention
- moving heavy jobs off peak hours
- upgrading infrastructure
13. Verify improvement
Recheck:
SHOW GLOBAL STATUS LIKE 'Slow_queries';
SHOW FULL PROCESSLIST;
Also monitor application response time, PHP-FPM logs, and Nginx errors.
Common Mistakes When Fixing Slow Queries
Adding indexes without using EXPLAIN
Indexes should be based on query behavior, not guesswork.
Increasing max_connections instead of fixing slow queries
If queries are slow, more connections may only allow more slow work to pile up.
Ignoring PHP-FPM
Slow MySQL queries can exhaust PHP workers and create web-server errors.
Ignoring disk I/O
A query may be slow because storage is saturated, not because SQL is badly written.
Using a very low slow-query threshold permanently
A low threshold can create large logs on busy servers. Use it carefully and monitor log size.
Killing queries randomly
Terminate sessions only after identifying what they are doing and what application impact it may have.
Optimizing only MySQL while ignoring the application
Some slow queries are generated by plugins, themes, reports, imports, or application code that needs to be fixed.
When Slow MySQL Queries Need Server Management
A single slow query can often be corrected with an index, code change, or configuration adjustment.
Recurring slow MySQL queries usually need a broader review of the application, database, and server environment.
Common recurring causes include:
- missing indexes
- inefficient application queries
- slow WordPress plugins
- database bloat
- high PHP-FPM concurrency
- storage bottlenecks
- insufficient memory
- heavy cron jobs
- frequent imports or exports
- traffic growth
- overloaded VPS resources
- database and web workloads competing on one server
OffshoreDedicated.NET provides expert server management for Linux web hosting, VPS, cloud, and dedicated server environments.
For standard database-backed websites, offshore web hosting can be suitable when managed hosting is preferred.
For applications requiring root access and isolated resources, offshore VPS servers provide more control over PHP, MySQL, caching, and server tuning.
For flexible deployment and scaling needs, offshore cloud servers can support changing workloads.
For heavy MySQL databases, high-traffic PHP applications, and sustained resource usage, offshore dedicated servers provide dedicated CPU, RAM, storage, and network capacity.
For location-specific hosting requirements, offshore Bulgaria dedicated servers are available.
For workloads where predictable transfer capacity matters, offshore bandwidth commit servers can support high-throughput deployments.
The correct solution depends on whether slow queries are caused by database design, application behavior, server tuning, storage performance, or infrastructure capacity.
Frequently Asked Questions
How do I find slow MySQL queries?
Enable and check the slow query log:
SHOW VARIABLES LIKE 'slow_query_log';
SHOW VARIABLES LIKE 'slow_query_log_file';
Then inspect the slow query log file.
How do I see currently running MySQL queries?
Use:
SHOW FULL PROCESSLIST;How do I find long-running queries?
Use:
SELECT ID, USER, HOST, DB, TIME, STATE, INFO
FROM INFORMATION_SCHEMA.PROCESSLIST
WHERE COMMAND != 'Sleep'
ORDER BY TIME DESC
LIMIT 20;
How do I know if a query is missing an index?
Use:
EXPLAIN SELECT ...;If MySQL scans many rows and does not use a useful key, an index may be needed.
Can slow MySQL queries cause Nginx 502 errors?
Yes. Slow queries can make PHP-FPM workers wait. If PHP-FPM becomes overloaded or stops responding, Nginx may return upstream errors such as 502 or 504.
Should I increase max_connections for slow queries?
Not as the first fix. If queries are slow, increasing connections may allow more slow sessions to accumulate. Fix the slow query cause first.
Can disk I/O make MySQL queries slow?
Yes. If storage is saturated or failing, MySQL queries may slow down even if the SQL is reasonable.
Final Thoughts
Slow MySQL queries can affect the entire web stack.
Start by checking live activity:
SHOW FULL PROCESSLIST;Then inspect slow query settings:
SHOW VARIABLES LIKE 'slow_query_log';
SHOW VARIABLES LIKE 'slow_query_log_file';
SHOW VARIABLES LIKE 'long_query_time';
Analyze specific queries with:
EXPLAIN SELECT ...;Also check server conditions:
free -m
uptime
iostat -xz 1
sudo dmesg -T | grep -Ei "I/O error|timeout|reset|read-only"
The right fix may be an index, query rewrite, application optimization, MySQL tuning, caching, or better infrastructure.
Effective troubleshooting means connecting the database symptoms with PHP-FPM behavior, Nginx errors, server load, memory, and storage performance.