

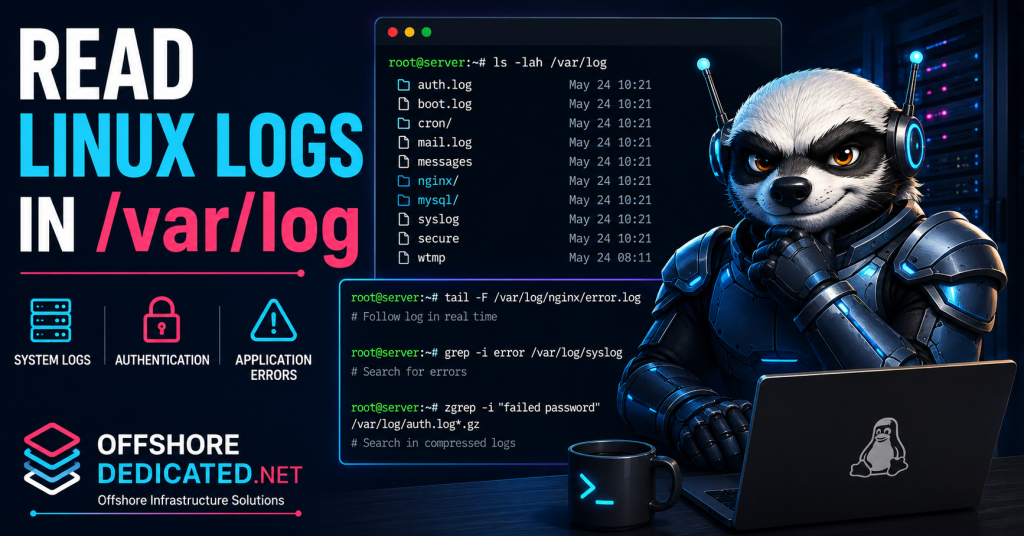
Linux servers record events that help administrators understand what the operating system, applications, authentication services, web servers, databases, and scheduled tasks are doing.
Many of these records are stored as text files under the /var/log directory.
When a website stops responding, SSH access fails, a database crashes, or a filesystem begins filling unexpectedly, the relevant log file often provides the first useful evidence.
Administrators commonly inspect /var/log to:
- Diagnose service and application errors
- Review authentication attempts
- Investigate web server failures
- Check database events
- Find recently updated logs
- Identify files consuming excessive disk space
- Review events that occurred before an outage
- Search active and archived logs
This guide explains the most important files under /var/log and shows how to read, search, follow, and manage them using standard Linux commands.
What Is the /var/log Directory?
The /var/log directory is the traditional location used for Linux system and application logs.
Start by listing its contents:
sudo ls -lah /var/logA server may contain files and directories such as:
auth.log
boot.log
btmp
cron
journal/
lastlog
mail.log
messages
mysql/
nginx/
secure
syslog
wtmp
The exact files depend on:
- Linux distribution
- Installed applications
- Logging configuration
- Whether
rsyslogor another syslog daemon is installed - Whether the system primarily uses the systemd journal
- Control panel and hosting software
- Container or application configuration
Do not expect every Linux server to contain the same filenames.
For example, Debian and Ubuntu commonly use:
/var/log/syslog
/var/log/auth.log
RHEL-compatible systems such as AlmaLinux, Rocky Linux, and CentOS traditionally use:
/var/log/messages
/var/log/secure
Some modern systems rely mainly on the systemd journal and may not create /var/log/syslog or /var/log/messages unless a traditional logging daemon is installed.
For systemd journal records, use the commands explained in our journalctl guide.
Common Linux Log Files Explained
Several log files appear frequently on Linux servers.
/var/log/syslog
On Debian and Ubuntu systems, /var/log/syslog may contain general system messages from:
- Background services
- Scheduled tasks
- Network components
- Applications
- System events
- Hardware-related processes
Read it with:
sudo less /var/log/syslogShow recent entries with:
sudo tail -n 100 /var/log/syslogSearch for errors:
sudo grep -i "error" /var/log/syslog/var/log/messages
RHEL-compatible distributions have traditionally stored general system messages in:
/var/log/messagesRead recent entries with:
sudo tail -n 100 /var/log/messagesSearch for failures:
sudo grep -Ei "error|failed|warning" /var/log/messages/var/log/auth.log
Debian and Ubuntu commonly record authentication activity in:
/var/log/auth.logThis may include:
- Successful SSH logins
- Failed login attempts
- Invalid usernames
- Public-key authentication
sudocommands- PAM authentication failures
- Session creation and termination
Show recent failed SSH logins:
sudo grep "Failed password" /var/log/auth.log | tail -50Show successful public-key logins:
sudo grep "Accepted publickey" /var/log/auth.logReview sudo activity:
sudo grep "sudo:" /var/log/auth.log/var/log/secure
RHEL-compatible systems commonly store authentication and security events in:
/var/log/secureFor example:
sudo grep "Failed password" /var/log/secure | tail -50A few failed SSH attempts are common on internet-facing servers. Repeated attempts from the same addresses may indicate automated scanning or brute-force activity.
Web Server Logs
Nginx commonly stores logs under:
/var/log/nginx/Typical files include:
/var/log/nginx/access.log
/var/log/nginx/error.log
Apache on Debian or Ubuntu commonly uses:
/var/log/apache2/access.log
/var/log/apache2/error.log
Apache on RHEL-compatible systems commonly uses:
/var/log/httpd/access_log
/var/log/httpd/error_log
The access log records requests received by the web server.
The error log records problems such as:
- Missing files
- Permission failures
- Upstream connection errors
- PHP-FPM failures
- Invalid configurations
- TLS certificate errors
- Request timeouts
Show recent Nginx errors:
sudo tail -n 100 /var/log/nginx/error.logSearch for upstream failures:
sudo grep -Ei "upstream|connection refused|timed out" \
/var/log/nginx/error.log
MySQL and MariaDB Logs
Possible database log locations include:
/var/log/mysql/error.log
/var/log/mysqld.log
/var/log/mariadb/mariadb.log
The exact path depends on the distribution and database configuration.
Show recent MySQL errors:
sudo tail -n 100 /var/log/mysql/error.logSearch for serious database messages:
sudo grep -Ei \
"error|crash|corrupt|too many connections|disk full" \
/var/log/mysql/error.log
Database logs can reveal:
- Startup failures
- Crash recovery
- Connection limits
- InnoDB problems
- Permission errors
- Storage failures
- Unexpected shutdowns
Cron Logs
Scheduled tasks may be recorded in:
/var/log/cronOr inside:
/var/log/syslogOn Debian or Ubuntu:
sudo grep CRON /var/log/syslog | tail -50On RHEL-compatible systems:
sudo tail -n 100 /var/log/cronCron logs may confirm that a command was launched, but the script’s output may be stored elsewhere or discarded unless output redirection was configured.
Mail Logs
Common mail log locations include:
/var/log/mail.log
/var/log/maillog
/var/log/exim_mainlog
/var/log/exim_rejectlog
They may contain:
- Delivery status
- Authentication failures
- Rejected messages
- DNS errors
- Connection timeouts
- TLS problems
- Deferred mail
- Queue activity
Mail logs may contain email addresses and message metadata, so handle exported copies carefully.
Binary Login Records
Not every item under /var/log is an ordinary text file.
Examples include:
/var/log/wtmp
/var/log/btmp
/var/log/lastlog
Do not read these with cat.
Use:
lastto inspect successful login history stored in wtmp.
Use:
sudo lastbto inspect failed login records stored in btmp.
Use:
lastlogto review the most recent login recorded for each account.
How to View Log Files with less
The less command is one of the safest ways to inspect large text logs.
Open a file with:
sudo less /var/log/syslogUseful controls include:
G          Jump to the end
g          Jump to the beginning
/error     Search forward for “error”
?error     Search backward for “error”
n          Move to the next match
N          Move to the previous match
q          Quit
Unlike cat, less does not print the entire file into the terminal at once.
This makes it more suitable for large logs.
For example:
sudo less /var/log/nginx/error.logThen type:
/upstreamto search for upstream-related errors.
How to Check Recent Log Entries with tail
The tail command displays the final lines of a file.
Show the final 10 lines:
sudo tail /var/log/nginx/error.logShow the final 100 lines:
sudo tail -n 100 /var/log/nginx/error.logShow the final 500 lines:
sudo tail -n 500 /var/log/mysql/error.logThis is useful when an error occurred recently and the relevant entry is likely near the end of the log.
To compare multiple logs, run separate commands:
sudo tail -n 50 /var/log/nginx/error.log
sudo tail -n 50 /var/log/mysql/error.log
Compare the timestamps to determine whether one service failed before another.
How to Follow Logs in Real Time
Use tail -f to display new entries as they are written:
sudo tail -f /var/log/nginx/error.logA practical troubleshooting method is:
- Follow the relevant log in one terminal.
- Reproduce the problem in another terminal or browser.
- Observe which messages appear at the exact failure time.
For example:
sudo tail -f /var/log/nginx/error.logThen reload the affected website.
To follow a file more reliably across log rotation, use:
sudo tail -F /var/log/nginx/error.logThe difference is important:
-ffollows the open file-Fretries and follows the filename if the file is replaced
Log rotation may rename the active file and create a new one. In that situation, tail -F is usually more dependable.
Press Ctrl+C to stop following the log.
How to Search Logs with grep
The grep command searches for matching text.
Search for errors:
sudo grep "error" /var/log/syslogSearch without case sensitivity:
sudo grep -i "error" /var/log/syslogSearch for several possible terms:
sudo grep -Ei "error|failed|timeout|refused" /var/log/syslogShow line numbers:
sudo grep -in "error" /var/log/nginx/error.logShow three lines before and five lines after each match:
sudo grep -i -B 3 -A 5 "out of memory" /var/log/syslogHere:
-B 3shows three lines before the match-A 5shows five lines after the match
Context matters because the message immediately before the final error may reveal the original cause.
Search recursively inside an application log directory:
sudo grep -Rin "connection refused" /var/log/nginx/Search authentication logs for one address:
sudo grep "203.0.113.15" /var/log/auth.logSearch Nginx logs for HTTP 500 responses:
sudo awk '$9 == 500' /var/log/nginx/access.log | tail -50This assumes the status code is stored in field nine. Custom Nginx log formats may use a different field layout.
How to Read Rotated and Compressed Logs
Active logs cannot grow indefinitely.
Linux commonly uses logrotate or application-specific rotation systems to rename, compress, and eventually remove older logs.
A directory may contain:
error.log
error.log.1
error.log.2.gz
error.log.3.gz
The files usually represent:
error.log— current active logerror.log.1— most recent rotated logerror.log.2.gz— older compressed logerror.log.3.gz— still older compressed log
Read an uncompressed rotated log with:
sudo less /var/log/nginx/error.log.1Read a compressed log with:
sudo zless /var/log/nginx/error.log.2.gzSearch compressed logs with:
sudo zgrep -i "upstream timed out" \
/var/log/nginx/error.log*.gz
Search active and rotated uncompressed logs:
sudo grep -i "upstream timed out" \
/var/log/nginx/error.log*
If an incident occurred several days ago, the evidence may no longer exist in the active file.
Always check rotated logs when the incident time falls outside the current log’s range.
How to Find Recently Updated Log Files
When you do not know which application created an error, search for files modified recently.
Find logs modified during the last 30 minutes:
sudo find /var/log -type f -mmin -30 -lsFind logs modified during the last 10 minutes:
sudo find /var/log -type f -mmin -10 -lsFor a cleaner timestamp-based list:
sudo find /var/log -type f -mmin -30 \
-printf '%TY-%Tm-%Td %TH:%TM:%TS %p\n' |
sort
This can reveal:
- An unexpected application log
- A service writing into a custom directory
- A rapidly changing error log
- A cron task generating output
- A security service recording repeated events
On busy hosting servers, many files may be updated simultaneously. Narrow the search to the approximate incident time or application directory where possible.
How to Find Large Log Files
A rapidly growing log can fill the root filesystem and cause unrelated services to fail.
Check directory-level usage:
sudo du -sh /var/log/* 2>/dev/null | sort -hFind the largest files and directories:
sudo du -ah /var/log | sort -h | tail -30Find regular files larger than 100 MB:
sudo find /var/log -type f -size +100M -lsA large log is often a symptom rather than the original cause.
For example:
Service enters a restart loop
        ↓
Each failed restart generates errors
        ↓
The log grows continuously
        ↓
The root filesystem becomes full
        ↓
Databases and applications begin failing
Deleting the log without fixing the restart loop only provides temporary relief.
Before removing or truncating a log, determine:
- Which service owns it
- Why messages are repeating
- Whether the log is actively being written
- Whether the file is required for an investigation
- Whether log rotation is configured correctly
Common /var/log Troubleshooting Examples
Find Why Nginx Returned a 502 Error
Check recent Nginx errors:
sudo tail -n 100 /var/log/nginx/error.logSearch for upstream failures:
sudo grep -Ei \
"connect\(\) failed|connection refused|upstream" \
/var/log/nginx/error.log |
tail -50
A 502 error may indicate:
- PHP-FPM is stopped
- The upstream socket does not exist
- Socket permissions are incorrect
- The backend application crashed
- Nginx is using the wrong upstream port
Also check the related service:
sudo systemctl status php8.3-fpmInvestigate Failed SSH Logins
On Debian or Ubuntu:
sudo grep "Failed password" /var/log/auth.log | tail -50On a RHEL-compatible system:
sudo grep "Failed password" /var/log/secure | tail -50Count repeated source addresses:
sudo grep "Failed password" /var/log/auth.log |
awk '{for (i=1; i<=NF; i++) if ($i=="from") print $(i+1)}' |
sort |
uniq -c |
sort -nr |
head
This helps identify addresses generating repeated authentication failures.
Investigate a Full Root Filesystem
Check filesystem usage:
df -hThen inspect /var/log:
sudo du -sh /var/log/* 2>/dev/null | sort -hIf one log is unusually large, inspect its recent messages:
sudo tail -n 100 /path/to/large.logRepeated identical errors may reveal the malfunctioning service.
For a broader disk investigation, see our guide on checking server disk usage with df, du, and ncdu.
When Log Growth Becomes a Server Problem
Occasional application errors are normal, but uncontrolled log growth can affect the entire server.
Warning signs include:
/var/logconsuming several gigabytes unexpectedly- The root filesystem approaching 100% usage
- One service creating thousands of messages per minute
- Logs rotating more frequently than expected
- Applications failing because they cannot write data
- Databases refusing to start because storage is full
- Repeated errors returning immediately after cleanup
Recurring log floods may require investigation of:
- Broken service configuration
- Restart loops
- Application bugs
- Authentication attacks
- Database failures
- Missing files or permissions
- Storage problems
- Incorrect log rotation
- Debug logging left enabled
OffshoreDedicated.NET provides expert server management for Linux VPS, cloud, and dedicated servers.
When repeated failures are caused by resource limits or sustained workload growth, suitable infrastructure options include:
- Offshore VPS servers for isolated virtual resources
- Offshore cloud servers for flexible deployment requirements
- Offshore Streaming dedicated servers for sustained high-resource workloads
Infrastructure upgrades should follow diagnosis. More resources will not permanently solve a broken application, restart loop, or incorrect logging configuration.
Recommended reading:
- How to Use journalctl in Linux: Essential Commands Explained
- How CDN Caching Actually Works: Origin, Cache-Control, Edge Behavior & Misconfigurations
- How to Check Server Load in Linux (Load Average Explained)
- How to Investigate a Slow Linux Server (Step-by-Step Debugging Guide)
- How to Diagnose Memory Pressure in Linux (Beyond free -m)
Frequently Asked Questions
What is stored in /var/log?
The directory may contain system messages, authentication records, application logs, web server logs, database logs, mail logs, scheduled-task records, and binary login databases.
Why is /var/log/syslog missing?
The server may use /var/log/messages, rely mainly on the systemd journal, use a different logging daemon, or not have rsyslog installed.
Check:
systemctl status rsyslog
sudo ls -lah /var/log
How do I see the latest Linux log entries?
Use:
sudo tail -n 100 /path/to/logFor example:
sudo tail -n 100 /var/log/nginx/error.logHow do I watch a log in real time?
Use:
sudo tail -F /path/to/logHow do I search compressed .gz logs?
Use:
sudo zgrep -i "search term" /path/to/log*.gzCan I delete large files under /var/log?
Deleting logs without identifying the source can remove important evidence and provide only temporary relief. Determine which service owns the file and why it is growing before deleting or truncating it.
What is the difference between /var/log and journalctl?
/var/log is a directory containing traditional text logs, application logs, rotated archives, binary login records, and sometimes persistent journal data.
journalctl queries structured records stored by systemd-journald.
Many Linux servers use both.
Final Thoughts
The /var/log directory remains one of the most important places to investigate Linux server problems.
The most useful commands are:
sudo ls -lah /var/log
sudo less /path/to/log
sudo tail -n 100 /path/to/log
sudo tail -F /path/to/log
sudo grep -Ei "error|failed|timeout" /path/to/log
sudo zgrep -i "error" /path/to/log*.gz
sudo find /var/log -type f -mmin -30 -ls
sudo du -ah /var/log | sort -h | tail -30
Effective log analysis depends on three things:
- Selecting the correct file
- Restricting the investigation to the relevant time
- Reading earlier events instead of focusing only on the final error
Use /var/log together with journalctl, service status commands, and live resource monitoring to determine whether a failure began in the application, service manager, operating system, or underlying infrastructure.