

Linux servers do not only record application and service logs. The Linux kernel also records important messages about hardware, drivers, memory, storage, filesystems, network interfaces, boot activity, and low-level system events.
The dmesg command is used to view messages from the kernel ring buffer.
Administrators commonly use dmesg to investigate:
- Disk and I/O errors
- Filesystem warnings
- Out-of-memory events
- Network interface changes
- Driver problems
- Kernel warnings
- Hardware-related messages
- Boot-time device detection
- Read-only filesystem events
When a server becomes slow, unstable, or starts reporting strange application errors, dmesg can reveal whether the real problem is happening below the application layer.
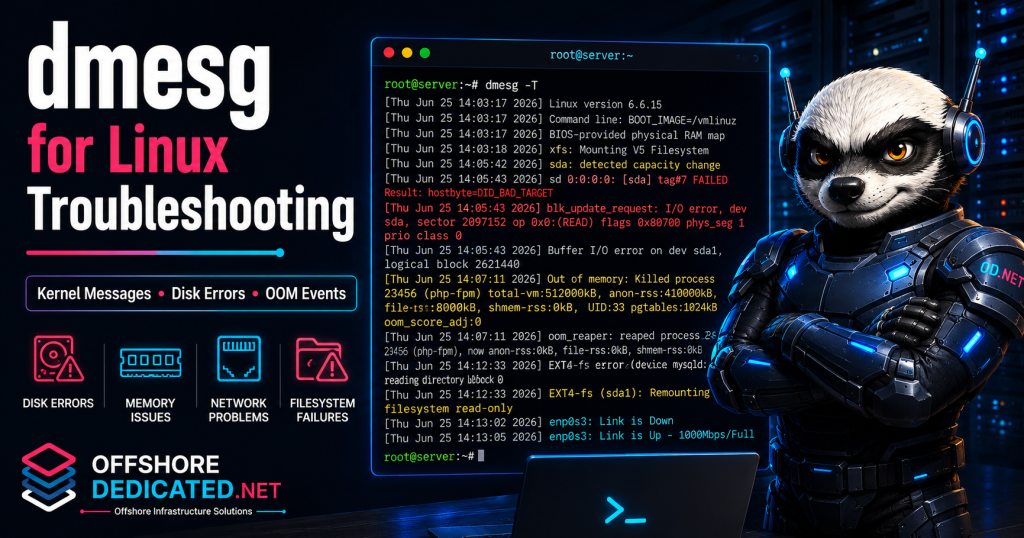
This guide explains how to use dmesg in Linux to inspect kernel messages and diagnose common server problems.
What Is the dmesg Command?
dmesg displays messages from the Linux kernel ring buffer.
The kernel ring buffer is a memory area where the Linux kernel stores recent messages about system activity. These messages may include information about:
- CPU detection
- Memory initialization
- Disk devices
- Network interfaces
- Filesystems
- Kernel modules
- Device drivers
- Hardware events
- Out-of-memory conditions
- I/O errors
- Boot messages
The basic command is:
dmesgOn many systems, administrative privileges are required:
sudo dmesgUnlike application logs under /var/log, dmesg focuses on kernel-level messages. It is especially useful when an application failure may actually be caused by a deeper system issue.
For example, a database may appear to be slow, but dmesg may reveal disk timeouts. A web server may stop responding, but dmesg may show that the kernel killed PHP-FPM because of memory pressure.
For service logs, use the systemd journal as explained in our guide on how to use journalctl in Linux. For traditional text logs, see our guide on how to read Linux logs in /var/log.
How to View Kernel Messages
To view kernel messages, run:
sudo dmesgThe output may contain many lines, especially on systems that have been running for a long time.
To inspect the output more comfortably, pipe it into less:
sudo dmesg | lessInside less, useful controls include:
G          Jump to the end
g          Jump to the beginning
/error     Search for “error”
n          Move to the next search match
q          Quit
The most recent kernel messages are usually near the bottom of the output.
To show only the last 100 lines:
sudo dmesg | tail -n 100This is often the first command to run when investigating a recent hardware, storage, memory, or kernel-level issue.
How to Display Human-Readable Timestamps
Default dmesg output may show timestamps as seconds since boot.
Example:
[43215.193842] nvme nvme0: I/O timeoutThis tells you when the event occurred relative to the system boot, but it is not always convenient during incident investigation.
To display human-readable timestamps, use:
sudo dmesg -TExample output:
[Thu Jun 25 14:03:17 2026] nvme nvme0: I/O timeoutThis makes it easier to compare kernel messages with:
- Web server logs
- Database logs
- Monitoring alerts
- User reports
- Scheduled tasks
- Service restarts
However, human-readable dmesg -T timestamps may be affected if the system clock changed after boot.
For precise incident timelines on systemd systems, also compare with:
sudo journalctl -kThe journalctl -k command shows kernel messages stored in the systemd journal.
How to Show Recent Kernel Messages
For recent kernel activity, combine dmesg with tail.
Show the last 50 lines:
sudo dmesg -T | tail -n 50Show the last 100 lines:
sudo dmesg -T | tail -n 100Show the last 200 lines:
sudo dmesg -T | tail -n 200This is useful after:
- Attaching a disk
- Restarting a network service
- Rebooting a server
- Seeing a filesystem warning
- Experiencing high load
- Investigating a sudden service crash
- Checking for OOM events
Recent kernel messages can reveal issues that application logs do not show directly.
For example, Nginx may only report an upstream timeout, while dmesg shows storage delays that caused the application to become unresponsive.
How to Filter dmesg by Severity
Modern versions of dmesg support filtering by severity level.
Show warnings and errors:
sudo dmesg --level=warn,err,crit,alert,emergA shorter form may also work:
sudo dmesg -l warn,errCommon severity levels include:
emerg
alert
crit
err
warn
notice
info
debug
Filtering by severity helps reduce noise when you want to focus on serious kernel messages.
For example:
sudo dmesg -T --level=err,crit,alert,emergThis shows error-level and more severe kernel events with readable timestamps.
If your server does not support these options, check the available syntax:
dmesg --helpYou can always use grep as a fallback.
How to Search dmesg Output with grep
The most common way to search dmesg output is to pipe it into grep.
Search for errors:
sudo dmesg -T | grep -i "error"Search for warnings:
sudo dmesg -T | grep -i "warning"Search for failed operations:
sudo dmesg -T | grep -i "failed"Search for multiple patterns:
sudo dmesg -T | grep -Ei "error|failed|timeout|reset"Useful search terms include:
error
failed
timeout
reset
I/O
oom
killed process
read-only
segfault
watchdog
hung task
Always review surrounding lines when you find an important match. The message before or after the match may provide the missing context.
For example:
sudo dmesg -T | grep -i -B 3 -A 5 "I/O error"This shows three lines before and five lines after each match.
How to Find Disk and I/O Errors
Disk and storage problems often appear in kernel messages before they become obvious at the application level.
Search for common disk-related errors:
sudo dmesg -T | grep -Ei \
"I/O error|buffer I/O|blk_update_request|timeout|reset|failed command"
You can also search for common storage device names:
sudo dmesg -T | grep -Ei "sda|vda|nvme|ata|scsi"Potentially serious messages include:
I/O error
Buffer I/O error
blk_update_request
device reset
command timeout
failed command
EXT4-fs error
XFS error
remounting filesystem read-only
Disk and I/O errors can cause symptoms such as:
- High server load
- Slow database queries
- Web requests timing out
- Backups failing
- Processes stuck in uninterruptible sleep
- Filesystem becoming read-only
- Applications failing to write files
- Control panel services becoming unstable
If high load is present but CPU usage is not high, storage waits may be involved. See our guide on how to investigate high disk I/O in Linux for a deeper workflow.
Check current disk usage as well:
df -h
df -i
A full filesystem and a failing disk are different problems, but both can create application errors.
How to Detect Out-of-Memory Events
When Linux runs critically low on memory, the kernel may terminate one or more processes using the OOM killer.
Search for OOM-related messages:
sudo dmesg -T | grep -Ei "out of memory|oom|killed process"Typical output may resemble:
Out of memory: Killed process 19284 (mysqld)Or:
Memory cgroup out of memory: Killed process 29108 (php-fpm)This is extremely important because the affected service may not explain why it stopped.
For example, MySQL may simply appear down, while dmesg shows that the kernel killed it because of memory exhaustion.
After finding an OOM event, check memory usage:
free -mCheck swap:
swapon --showShow memory-heavy processes:
ps aux --sort=-%mem | head -20Also inspect the affected service:
sudo systemctl status mysqlAn OOM event may be caused by:
- Not enough RAM
- No swap or insufficient swap
- Memory leak
- Too many PHP-FPM workers
- Database buffer settings
- Traffic spikes
- Container memory limits
- Background jobs
- Multiple heavy services on one server
For a deeper memory workflow, see our guide on how to diagnose memory pressure in Linux.
How to Check Network Interface Messages
Kernel messages can show network interface events such as link changes, driver resets, and device renaming.
Search for network-related messages:
sudo dmesg -T | grep -Ei \
"link is down|link becomes ready|renamed from|carrier|NETDEV WATCHDOG|tx timeout"
These messages may reveal:
- Interface went down
- Interface came back up
- Virtual NIC was renamed
- Driver reset occurred
- Network timeout happened
- Link negotiation changed
- Hypervisor network event occurred
Check current network interfaces:
ip -br linkShow IP addresses:
ip -br addrShow interface statistics:
ip -s linkOn physical servers, ethtool may provide additional details:
sudo ethtool INTERFACEReplace INTERFACE with the actual interface name, such as eth0, ens3, or enp1s0.
On VPS and cloud servers, hardware-level network details may be limited because the guest system does not directly control the physical network device.
How to Find Filesystem and Read-Only Errors
Filesystem problems can cause serious application failures.
Search for filesystem errors:
sudo dmesg -T | grep -Ei \
"filesystem|EXT4-fs|XFS|BTRFS|read-only|remount|journal aborted"
Important messages may include:
EXT4-fs error
XFS error
journal aborted
Remounting filesystem read-only
Read-only file system
A read-only filesystem can break:
- Database writes
- Uploads
- Log writing
- Cache creation
- Package updates
- Session storage
- Temporary files
- Control panel operations
Check mounted filesystems:
findmntCheck whether a filesystem is mounted read-only:
mount | grep ' ro[,)]'If the root filesystem became read-only, do not simply force it back to read-write without understanding the cause.
The kernel may remount a filesystem as read-only to prevent further damage after detecting serious errors.
Check:
- Disk health
- RAID status
- Recent crashes
- Filesystem errors
- Backup availability
- Hosting-provider storage events
For general filesystem usage checks, see our guide on how to check server disk usage in Linux.
How to Follow Kernel Messages in Real Time
Some systems support live-following kernel messages with:
sudo dmesg --followThis shows new kernel messages as they are generated.
You can also use:
sudo journalctl -k -fFollowing kernel messages is useful when:
- Attaching storage
- Restarting networking
- Loading a kernel module
- Reproducing a driver issue
- Testing a failing disk
- Investigating filesystem errors
- Watching for OOM events
Example:
sudo journalctl -k -fThen reproduce the issue in another terminal or browser.
Stop following the output with:
Ctrl+CFor modern systemd-based servers, journalctl -k -f is often more flexible because it uses the journal and can be combined with other journal options.
Practical dmesg Troubleshooting Examples
Example 1: Website is slow but CPU is not high
Check load:
uptimeCheck for disk-related kernel errors:
sudo dmesg -T | grep -Ei "I/O error|timeout|reset"If storage errors appear, the slow website may be caused by disk waits rather than CPU saturation.
Example 2: MySQL stopped unexpectedly
Check MySQL:
sudo systemctl status mysqlSearch for OOM events:
sudo dmesg -T | grep -Ei "out of memory|oom|killed process"If the kernel killed mysqld, the root cause is memory pressure, not simply a database service failure.
Example 3: Uploads suddenly fail
Check the application error message. If it says:
Read-only file systemSearch kernel messages:
sudo dmesg -T | grep -Ei "read-only|remount|EXT4-fs|XFS"If the filesystem was remounted read-only, investigate storage health before changing application permissions.
Example 4: Network disconnects briefly
Search kernel messages:
sudo dmesg -T | grep -Ei "link is down|carrier|NETDEV WATCHDOG|tx timeout"If network interface events appear at the same time as the outage, the issue may involve the interface, driver, virtual network layer, or hosting infrastructure.
Common dmesg Mistakes
Assuming dmesg only matters for physical servers
dmesg is useful on VPS, cloud, and dedicated servers. Virtual machines still record kernel messages about memory, block devices, network interfaces, and filesystems.
Ignoring timestamps
Always compare kernel messages with the time of the reported incident. An old boot-time warning may be unrelated to a current outage.
Searching only for “error”
Important kernel events may use words such as timeout, reset, oom, killed process, read-only, or hung task.
Treating application symptoms as root causes
A database crash, PHP error, or Nginx timeout may be caused by memory pressure, disk errors, or filesystem problems shown in dmesg.
Forcing a read-only filesystem back to write mode
A read-only remount may indicate serious filesystem or storage trouble. Investigate before forcing changes.
Relying only on dmesg
Use dmesg with journalctl, /var/log, service status commands, and resource checks.
When Kernel Errors Require Server Management
Kernel-level messages often point to problems deeper than a single application.
Recurring warnings may indicate:
- Disk instability
- Filesystem damage
- Memory pressure
- OOM kills
- Driver problems
- Network interface resets
- Virtual disk issues
- Resource exhaustion
- Hardware or hypervisor events
OffshoreDedicated.NET provides expert server management for Linux VPS, cloud, and dedicated server environments.
If the issue is caused by sustained resource pressure, the better solution may be infrastructure planning rather than repeated emergency fixes.
Useful options include:
- Offshore VPS servers for isolated virtual resources
- Offshore cloud servers for flexible deployment needs
- Offshore Streaming Dedicated servers or Offshore Bandwidth Commit Servers for heavy workloads requiring dedicated CPU, memory, storage, and network capacity
The correct decision depends on whether the problem is caused by configuration, application behavior, resource limits, or underlying hardware/storage conditions.
Frequently Asked Questions
What does dmesg do in Linux?
dmesg displays messages from the Linux kernel ring buffer. These messages include boot events, hardware detection, driver activity, storage errors, filesystem warnings, network events, and memory-related messages.
How do I see recent dmesg messages?
Use:
sudo dmesg -T | tail -n 100How do I search dmesg for errors?
Use:
sudo dmesg -T | grep -Ei "error|failed|timeout|reset"How do I check for OOM kills with dmesg?
Use:
sudo dmesg -T | grep -Ei "out of memory|oom|killed process"What is the difference between dmesg and journalctl?
dmesg reads the kernel ring buffer. journalctl reads logs stored in the systemd journal. Kernel messages can often be viewed with both dmesg and journalctl -k.
Why does dmesg show old boot messages?
The kernel ring buffer includes messages generated during boot and later runtime events. On busy systems, older messages may eventually be overwritten.
Can dmesg show previous boot logs?
Usually, dmesg focuses on the current boot. To inspect previous-boot kernel messages on systemd systems, use:
sudo journalctl -k -b -1Final Thoughts
The dmesg command is one of the most useful tools for diagnosing low-level Linux server problems.
While application logs show what services experienced, dmesg can reveal what the kernel observed underneath those services.
The most useful commands include:
sudo dmesg -T
sudo dmesg -T | tail -n 100
sudo dmesg -T | grep -Ei "error|failed|timeout|reset"
sudo dmesg -T | grep -Ei "I/O error|buffer I/O|read-only"
sudo dmesg -T | grep -Ei "out of memory|oom|killed process"
sudo journalctl -k -f
Use dmesg when investigating unexplained server slowdowns, disk errors, memory pressure, filesystem problems, and network interface events.
For the best results, combine it with journalctl, /var/log, systemctl status, disk checks, memory checks, and process monitoring.