High CPU is the most visible symptom — and the easiest to misdiagnose.
This guide shows how experienced sysadmins actually investigate CPU problems: not just spotting a hot process, but understanding why it is hot and whether CPU is truly the bottleneck.
What “High CPU” Can Mean
High CPU can be caused by:
- Legitimate workload (traffic spike)
- Inefficient code (loops, bad queries)
- Kernel/system activity (interrupts, softirqs)
- Lock contention or spin
- Misleading metrics (high load, low CPU)
👉 Your job: separate signal from noise.
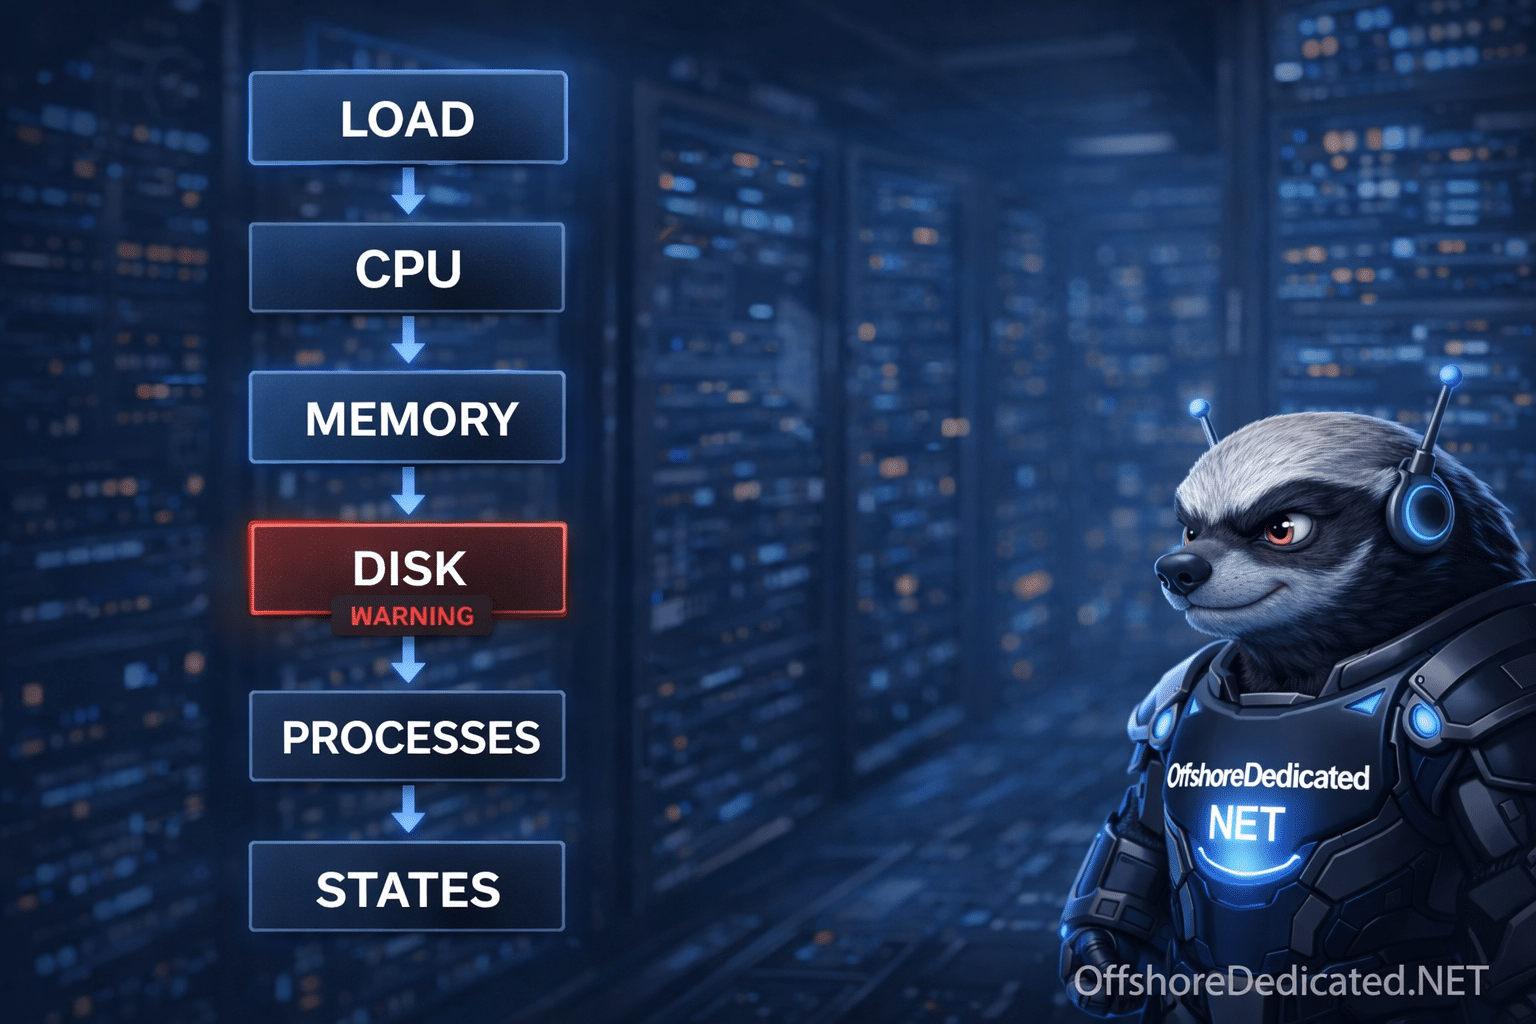
Step 0: Confirm It’s Actually a CPU Problem
uptime- If load is high and CPU is high → likely CPU-bound
- If load is high but CPU idle is high → NOT CPU (check I/O)
Step 1: top — First Look (Correctly Interpreted)
topKeys (Linux / macOS / Windows via SSH)
- Sort by CPU:
P(same everywhere) - Per-core view:
1(same everywhere) - Kill:
k(same everywhere)
macOS: if function keys are needed, use
Fnas required. In SSH/WSL, behavior is the same as Linux.
What to read (not just see)
Focus on CPU breakdown line:
%Cpu(s): us sy ni id wa hi si st| Field | Meaning |
|---|---|
| us | User space CPU |
| sy | Kernel CPU |
| wa | I/O wait |
| hi/si | Hardware/Software interrupts |
| st | Steal (virtualized env) |
Step 2: Decide the CPU Pattern (Critical)
Pattern A: High us (user CPU)
👉 Application-level issue
Common causes:
- PHP/Python loops
- Inefficient queries
- High traffic
Pattern B: High sy (system CPU)
👉 Kernel-level work
Common causes:
- Heavy I/O
- Networking stack
- Filesystem overhead
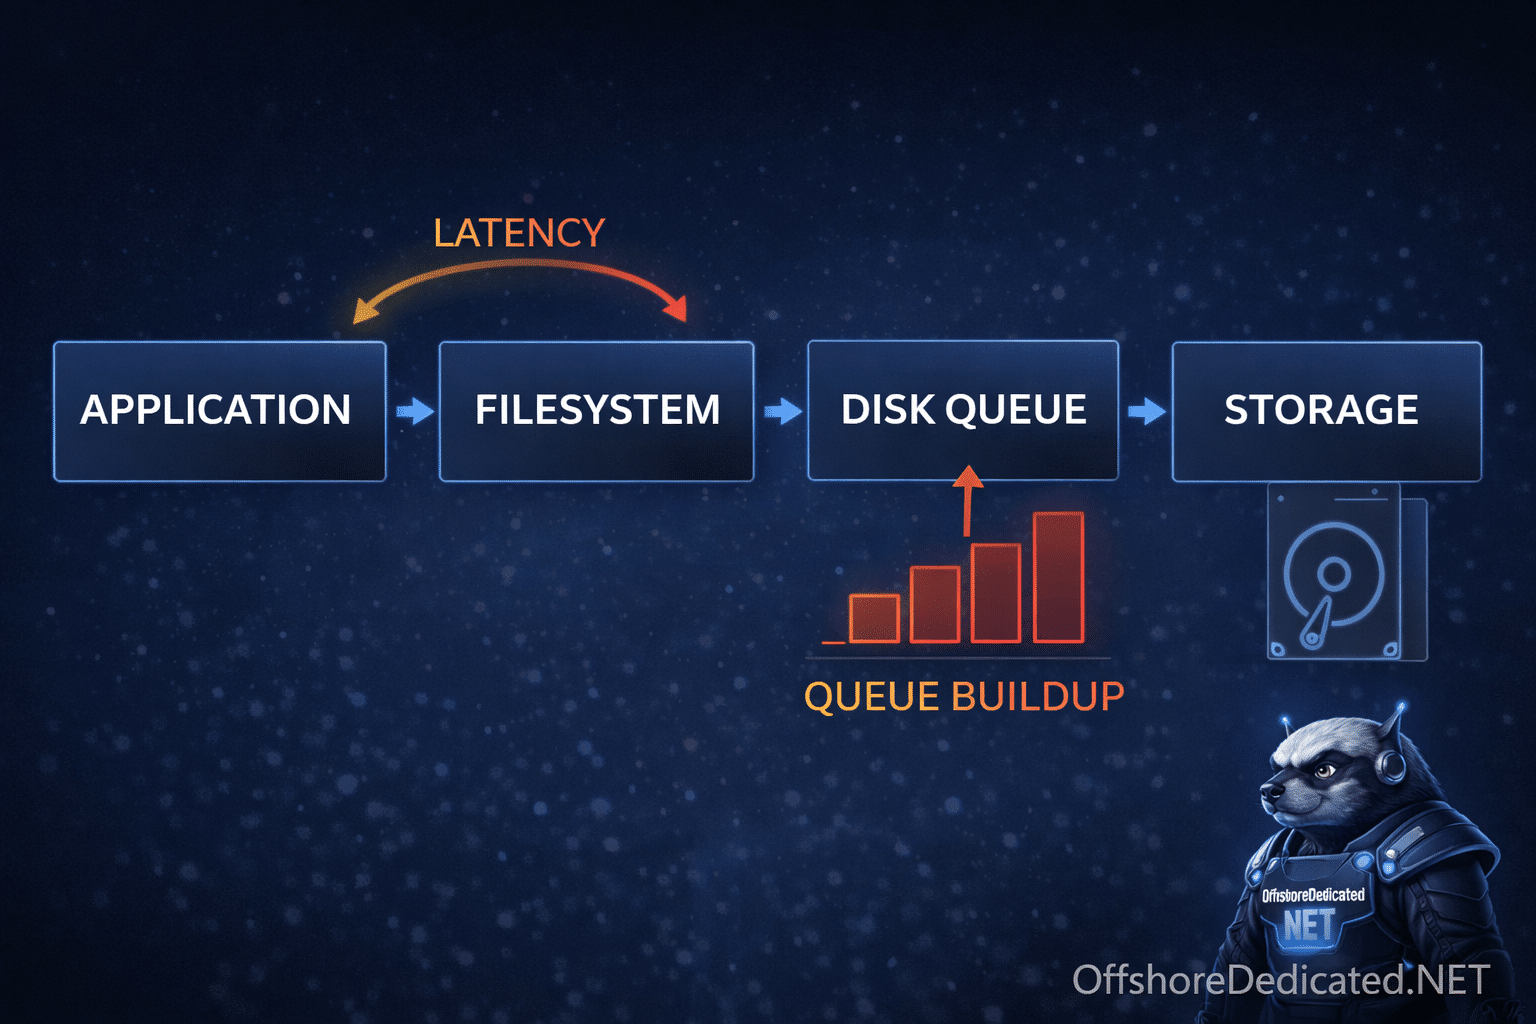
Pattern C: High wa (I/O wait)
👉 NOT CPU problem → Disk bottleneck
Pattern D: High st (steal time)
👉 Virtualization issue (VPS/cloud) → noisy neighbors or host contention
Step 3: Identify the Offending Process
htopKeys
- Sort:
F6(Mac:Fn+F6if needed) - Tree:
F5 - Filter:
F4
What experts check
- Single process at 100%? (single-thread bottleneck)
- Many processes each 20–30%? (parallel load)
- Parent-child explosion? (worker pools)
Step 4: ps for Precise Snapshot
ps -eo pid,ppid,cmd,%cpu,%mem --sort=-%cpu | headWhy this matters
- Stable snapshot (unlike top refresh)
- Easy logging and sharing
Step 5: Threads vs Processes (Very Important)
Some apps are multi-threaded (Java, MySQL).
top -H -p PID👉 Shows threads consuming CPU
Step 6: Check CPU Core Saturation
In top, press:
1Interpretation
- One core at 100%, others idle → single-thread bottleneck
- All cores high → true system-wide load
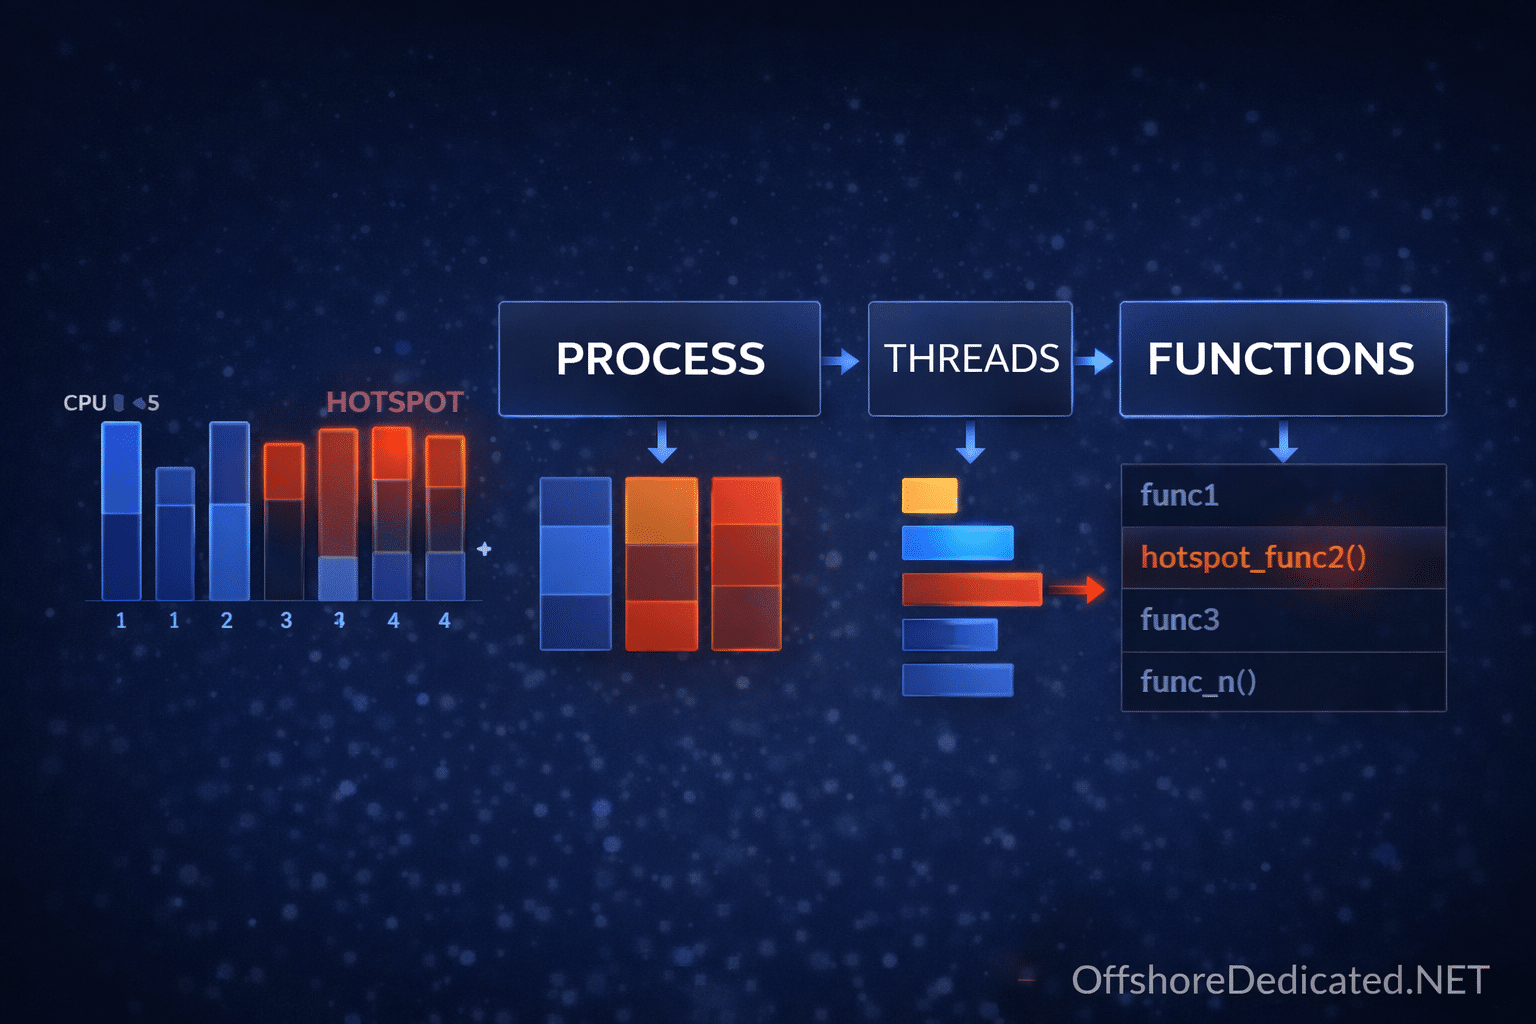
Step 7: Deep Analysis with perf (Expert Layer)
perf topLinux only. Not available natively on macOS. On macOS, use
dtrace/Instruments. On Windows, use WSL or Windows Performance Analyzer.
What it shows
- Functions consuming CPU
- Hot code paths
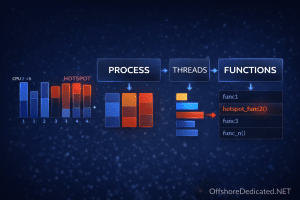
👉 This is how you move from “which process” → “which function”
Step 8: Correlate with System Context
Always cross-check:
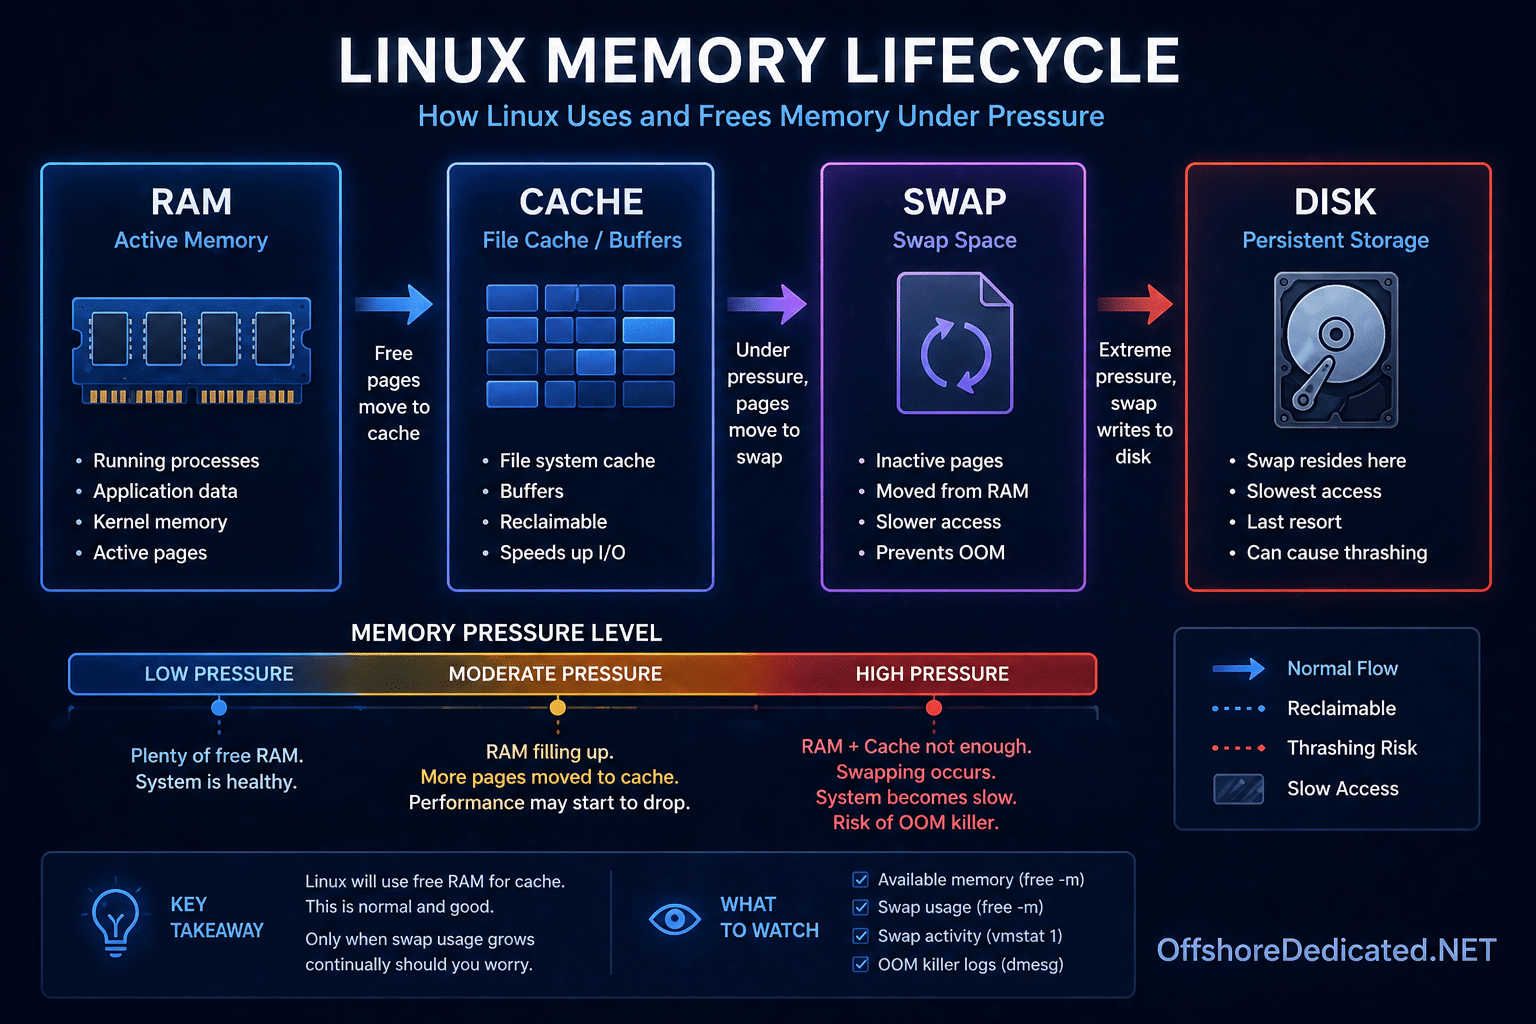
- Disk (
iostat) → is CPU waiting? - Memory (
free -m) → swapping? - Network (
sar -n DEV) → packet load?
👉 CPU rarely exists in isolation
Real Production Case (End-to-End)
Situation
- API slow
- Users timing out
Step 1: Load
uptime → load = 8 (on 4 cores)Step 2: CPU
top → us = 85%→ CPU-bound confirmed
Step 3: htop
- Python process at 180% (multi-core)
Step 4: Threads
top -H -p PID- One thread dominating
Step 5: perf
perf top- Function: JSON parsing loop
Diagnosis
👉 Inefficient parsing loop causing CPU saturation
Fix
- Optimize code
- Add caching
- Scale horizontally
Thresholds (Practical Guidance)
| Metric | Healthy | Warning |
| CPU usage | <70% sustained | >85% sustained |
| Load vs cores | ≤ cores | >1.5× cores |
| Steal time | ~0% | >5% |
Common Mistakes
❌ Assuming high load = CPU
Load includes waiting tasks (I/O, locks)
❌ Ignoring system CPU (sy)
Kernel work can dominate in networking or storage-heavy apps
❌ Killing processes without root cause
You remove the symptom, not the issue
When This Matters in Production
CPU issues affect:
- APIs and web apps
- Databases
- Real-time processing systems
Related Linux Guides
- How to Investigate a Slow Linux Server
- How to Investigate High Disk I/O in Linux
- How to Monitor Processes with htop
Final Takeaway
High CPU is a symptom.
An expert identifies:
👉 Which workload 👉 Which thread 👉 Which function
That is the difference between monitoring and mastery.